
Compare Linc with Similar Stocks
Dashboard
Negative results in Mar 26
- ROCE(HY) Lowest at 18.52%
- NET SALES(Q) At Rs 137.67 cr has Fallen at -10.56%
- PBT LESS OI(Q) At Rs 13.14 cr has Fallen at -11.69%
Despite the size of the company, domestic mutual funds hold only 0% of the company
Consistent Underperformance against the benchmark over the last 3 years
Total Returns (Price + Dividend) 
Latest dividend: 1.5 per share ex-dividend date: Sep-16-2025
Risk Adjusted Returns v/s
Returns Beta

News

Linc Ltd is Rated Sell by MarketsMOJO
Linc Ltd is rated 'Sell' by MarketsMOJO, with this rating last updated on 03 Nov 2025. However, the analysis and financial metrics discussed here reflect the stock's current position as of 09 June 2026, providing investors with an up-to-date view of the company’s fundamentals, returns, and market standing.
Read full news article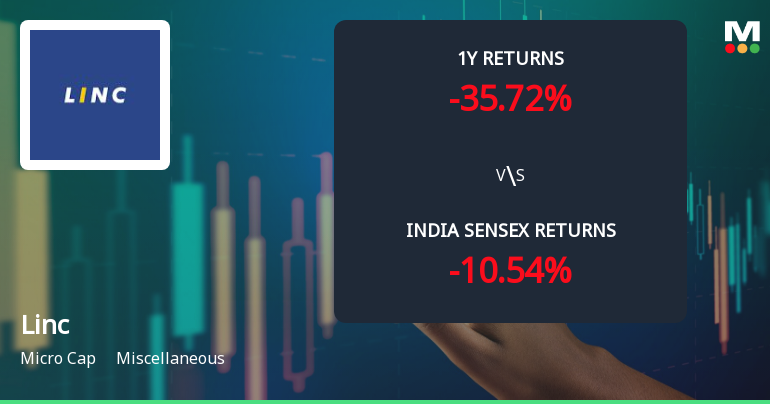
Linc Ltd Technical Momentum Shifts Amid Bearish Market Sentiment
Linc Ltd, a micro-cap player in the miscellaneous sector, has experienced a notable shift in its technical momentum, moving from mildly bearish to a more pronounced bearish stance. Recent technical indicators including MACD, RSI, Bollinger Bands, and moving averages reveal a complex picture of weakening price momentum, signalling caution for investors amid a challenging market backdrop.
Read full news article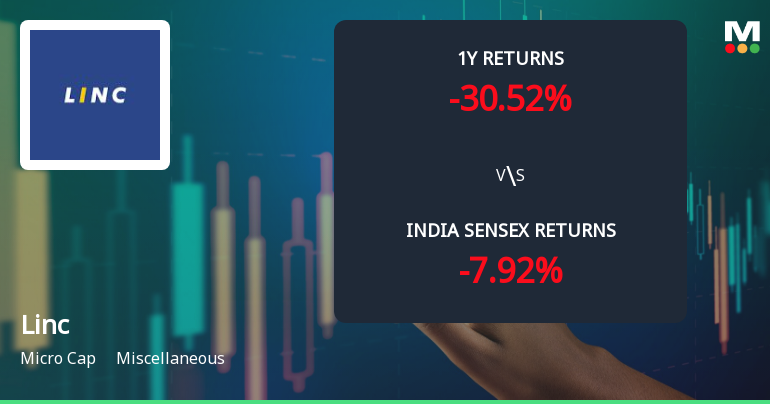
Linc Ltd Technical Momentum Shifts Amid Mixed Market Signals
Linc Ltd (NSE: 801304) has exhibited a subtle shift in its technical momentum, moving from a bearish stance to a mildly bearish outlook, as reflected in recent indicator readings. Despite a modest day gain of 1.39%, the micro-cap stock’s technical landscape remains complex, with mixed signals from MACD, RSI, moving averages, and other momentum oscillators. This article analyses these developments in detail, placing them in the context of Linc’s price action and broader market performance.
Read full news article Announcements
Disclosures under Reg. 29(2) of SEBI (SAST) Regulations 2011
10-Jun-2026 | Source : BSEThe Exchange has received the disclosure under Regulation 29(2) of SEBI (Substantial Acquisition of Shares & Takeovers) Regulations 2011 for Bimla Devi Jalan Trust
Disclosures under Reg. 29(2) of SEBI (SAST) Regulations 2011
10-Jun-2026 | Source : BSEThe Exchange has received the disclosure under Regulation 29(2) of SEBI (Substantial Acquisition of Shares & Takeovers) Regulations 2011 for Deepak Jalan
Disclosures under Reg. 29(2) of SEBI (SAST) Regulations 2011
10-Jun-2026 | Source : BSEThe Exchange has received the disclosure under Regulation 29(2) of SEBI (Substantial Acquisition of Shares & Takeovers) Regulations 2011 for Aloke Jalan
Corporate Actions

No Upcoming Board Meetings

Linc Ltd has declared 30% dividend, ex-date: 16 Sep 25

Linc Ltd has announced 5:10 stock split, ex-date: 20 Dec 24

Linc Ltd has announced 1:1 bonus issue, ex-date: 20 Dec 24

No Rights history available
Quality key factors
Valuation key factors
Technicals key factors
 Technical Indicator Scale: Bearish, Mildly Bearish, Sideways, Mildly Bullish, Bullish Turned
 Shareholding Snapshot : Mar 2026
Shareholding Compare (%holding)
Promoters
None
Held by 0 Schemes
Held by 20 FIIs (0.84%)
Sarita Jalan (8.72%)
Mitsubishi Pencil Co Ltd (13.45%)
19.39%
Quarterly Results Snapshot (Consolidated) - Mar'26 - YoY

YoY Growth in quarter ended Mar 2026 is -10.56% vs 9.33% in Mar 2025
YoY Growth in quarter ended Mar 2026 is -13.63% vs 4.85% in Mar 2025
Half Yearly Results Snapshot (Standalone) - Sep'25
Growth in half year ended Sep 2025 is 2.87% vs 7.94% in Sep 2024
Growth in half year ended Sep 2025 is 1.98% vs 13.65% in Sep 2024
Nine Monthly Results Snapshot (Standalone) - Dec'25
YoY Growth in nine months ended Dec 2025 is 3.95% vs 4.67% in Dec 2024
YoY Growth in nine months ended Dec 2025 is -4.04% vs 14.74% in Dec 2024
Annual Results Snapshot (Consolidated) - Mar'26
YoY Growth in year ended Mar 2026 is -0.09% vs 7.02% in Mar 2025
YoY Growth in year ended Mar 2026 is -13.93% vs 11.20% in Mar 2025
About Linc Ltd

Company Coordinates


