
Compare LKP Securities with Similar Stocks
Total Returns (Price + Dividend) 
Latest dividend: 0.3 per share ex-dividend date: Jun-16-2025
Risk Adjusted Returns v/s
Returns Beta

News

LKP Securities Ltd is Rated Sell by MarketsMOJO
LKP Securities Ltd is rated 'Sell' by MarketsMOJO, with this rating last updated on 28 April 2026. However, the analysis and financial metrics discussed here reflect the stock's current position as of 15 June 2026, providing investors with the most recent insights into the company’s performance and outlook.
Read full news article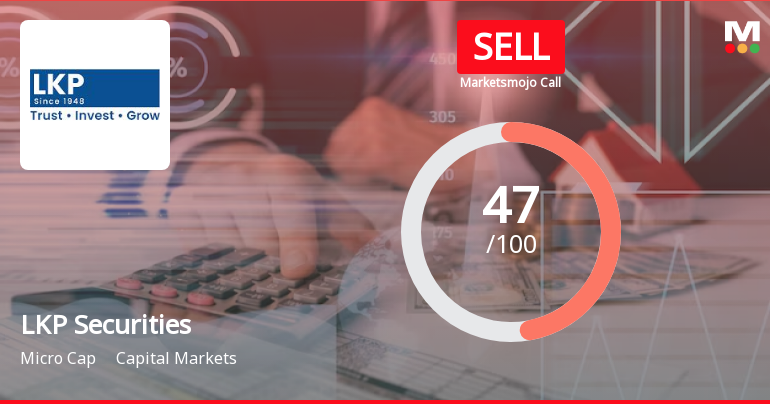
LKP Securities Ltd is Rated Sell by MarketsMOJO
LKP Securities Ltd is rated Sell by MarketsMOJO, with this rating last updated on 28 April 2026. However, the analysis and financial metrics discussed here reflect the stock’s current position as of 01 June 2026, providing investors with the latest insights into the company’s fundamentals, valuation, financial trends, and technical outlook.
Read full news article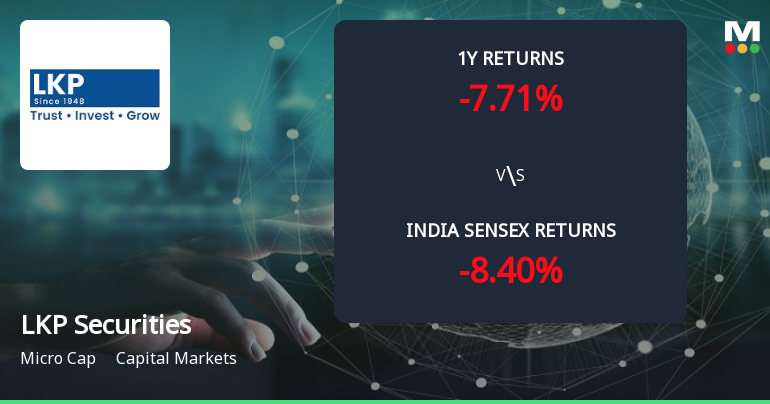
Golden Cross Confirmed: Do LKP Securities Ltd's Other Technical Indicators Agree?
The 50-day moving average has crossed above the 200-day moving average for LKP Securities Ltd, signalling a golden cross on 29 May 2026. Yet, the broader technical picture is mixed, with weekly indicators mostly bullish but monthly momentum remaining bearish. This divergence raises questions about the strength and reliability of the signal in the current context.
Read full news article Announcements
Announcement under Regulation 30 (LODR)-Newspaper Publication
18-Jun-2026 | Source : BSENewspaper Advertisement for attention of Equity Shareholders of the Company regarding 32nd Annual General Meeting to be held on Tuesday July 142026 through Video conference (VC)/other audio-visual means (OAVM)
Announcement under Regulation 30 (LODR)-Allotment of ESOP / ESPS
08-Jun-2026 | Source : BSEAllotment of ESOP under LKPS Employee Stock Option Scheme-2017 (LKPSESOP-2017)
Disclosures under Reg. 29(2) of SEBI (SAST) Regulations 2011
06-Jun-2026 | Source : BSEThe Exchange has received the disclosure under Regulation 29(2) of SEBI (Substantial Acquisition of Shares & Takeovers) Regulations 2011 for Bhavana Holdings Pvt Ltd & PACs
Corporate Actions

No Upcoming Board Meetings

LKP Securities Ltd has declared 15% dividend, ex-date: 16 Jun 25

No Splits history available

No Bonus history available

No Rights history available
Quality key factors
Valuation key factors
Technicals key factors
 Technical Indicator Scale: Bearish, Mildly Bearish, Sideways, Mildly Bullish, Bullish Turned
 Shareholding Snapshot : Mar 2026
Shareholding Compare (%holding)
Promoters
None
Held by 0 Schemes
Held by 1 FIIs (3.94%)
Mahendra V Doshi (on Behalf Of Partnership Firm, M/s L K Panday) (23.92%)
India Max Investment Fund Limited (3.94%)
18.62%
Quarterly Results Snapshot (Consolidated) - Mar'26 - YoY

YoY Growth in quarter ended Mar 2026 is 24.34% vs -31.82% in Mar 2025
YoY Growth in quarter ended Mar 2026 is -15.99% vs -51.71% in Mar 2025
Half Yearly Results Snapshot (Consolidated) - Sep'25

Growth in half year ended Sep 2025 is -15.37% vs 61.12% in Sep 2024
Growth in half year ended Sep 2025 is -17.89% vs 267.95% in Sep 2024
Nine Monthly Results Snapshot (Consolidated) - Dec'25
YoY Growth in nine months ended Dec 2025 is -11.60% vs 39.04% in Dec 2024
YoY Growth in nine months ended Dec 2025 is -23.67% vs 167.68% in Dec 2024
Annual Results Snapshot (Consolidated) - Mar'26
YoY Growth in year ended Mar 2026 is -4.45% vs 15.19% in Mar 2025
YoY Growth in year ended Mar 2026 is -22.10% vs 39.05% in Mar 2025
About LKP Securities Ltd

Company Coordinates


