
Compare Lloyds Engineeri with Similar Stocks
Dashboard
The company is Net-Debt Free
Healthy long term growth as Net Sales has grown by an annual rate of 53.80% and Operating profit at 33.09%
The company declared positive results in Mar'26 after flat results in Dec'25
With ROE of 11.4, it has a Very Expensive valuation with a 7.7 Price to Book Value
Despite the size of the company, domestic mutual funds hold only 0.26% of the company
Market Beating performance in long term as well as near term
Stock DNA
Industrial Manufacturing
INR 12,846 Cr (Small Cap)
68.00
26
0.23%
-0.17
11.36%
7.69
Total Returns (Price + Dividend) 
Latest dividend: 0.25 per share ex-dividend date: Aug-14-2025
Risk Adjusted Returns v/s
Returns Beta

News
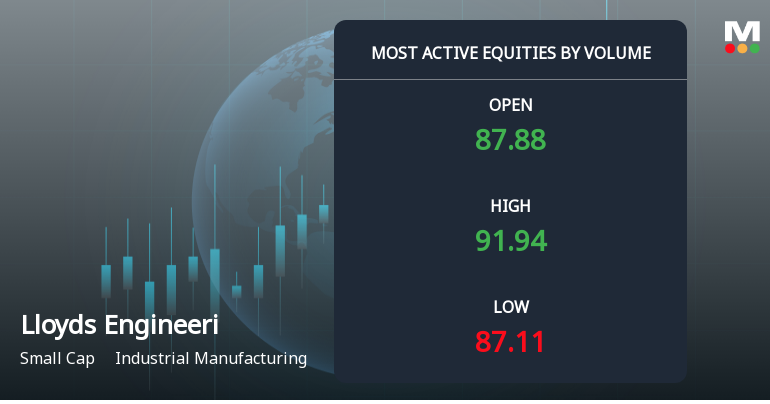
Lloyds Engineering Works Ltd Sees Exceptional Volume Surge, Signals Positive Momentum
Lloyds Engineering Works Ltd (LLOYDSENGG) has emerged as one of the most actively traded stocks on 22 June 2026, registering a remarkable surge in volume alongside robust price appreciation. The industrial manufacturing company recorded a total traded volume exceeding 1.53 crore shares, with the stock hitting a new 52-week high of ₹91.5, reflecting strong investor interest and positive market sentiment.
Read full news article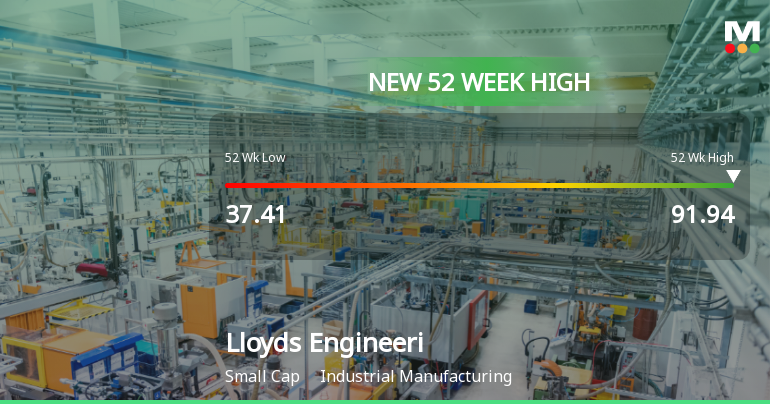
Broad-Based Technical Strength Lifts Lloyds Engineering Works Ltd to 52-Week High of Rs 91.5
Surging past its previous peaks, Lloyds Engineering Works Ltd touched a fresh 52-week high of Rs 91.5 on 22 Jun 2026, marking a remarkable 58.07% gain over the past year against the Sensex’s decline of 6.32%. This milestone reflects a powerful technical momentum that has propelled the stock well above its key moving averages and signals a sustained uptrend in the industrial manufacturing sector.
Read full news article
Announcements
Cut Off Date For The Shareholders Meeting Scheduled On July 15 2026
22-Jun-2026 | Source : BSEAttached
Intimation Of Shareholder Meeting Scheduled On July 15 2026
22-Jun-2026 | Source : BSEAttached
Announcement under Regulation 30 (LODR)-Acquisition
18-Jun-2026 | Source : BSEAttached
Corporate Actions

No Upcoming Board Meetings

Lloyds Engineering Works Ltd has declared 25% dividend, ex-date: 14 Aug 25

No Splits history available

No Bonus history available

Lloyds Engineering Works Ltd has announced 9:34 rights issue, ex-date: 28 Apr 25
Quality key factors
Valuation key factors
Technicals key factors
 Technical Indicator Scale: Bearish, Mildly Bearish, Sideways, Mildly Bullish, Bullish Turned
 Shareholding Snapshot : May 2026
Shareholding Compare (%holding)
Non Institution
14.3453
Held by 40 Schemes (0.15%)
Held by 65 FIIs (2.12%)
Lloyds Enterprises Limited (32.66%)
Thriveni Earthmovers Private Limited (9.05%)
38.05%
Quarterly Results Snapshot (Standalone) - Mar'26 - YoY

YoY Growth in quarter ended Mar 2026 is 130.75% vs -5.01% in Mar 2025
YoY Growth in quarter ended Mar 2026 is 130.69% vs -20.11% in Mar 2025
Half Yearly Results Snapshot (Standalone) - Sep'25

Growth in half year ended Sep 2025 is 20.38% vs 47.97% in Sep 2024
Growth in half year ended Sep 2025 is 3.32% vs 55.45% in Sep 2024
Nine Monthly Results Snapshot (Standalone) - Dec'25
YoY Growth in nine months ended Dec 2025 is 10.93% vs 32.31% in Dec 2024
YoY Growth in nine months ended Dec 2025 is -4.25% vs 41.12% in Dec 2024
Annual Results Snapshot (Standalone) - Mar'26
YoY Growth in year ended Mar 2026 is 39.22% vs 21.07% in Mar 2025
YoY Growth in year ended Mar 2026 is 18.60% vs 24.90% in Mar 2025
About Lloyds Engineering Works Ltd

Company Coordinates


