
Compare Lloyds Enterpris with Similar Stocks
Dashboard
Company has a Debt to Equity ratio (avg) of 0.04 times
Healthy long term growth as Net Sales has grown by an annual rate of 345.58% and Operating profit at 133.53%
With ROE of 6.9, it has a Very Expensive valuation with a 3 Price to Book Value
Despite the size of the company, domestic mutual funds hold only 0.27% of the company
With its market cap of Rs 11,865 cr, it is the biggest company in the sector and constitutes 11.17% of the entire sector
Stock DNA
Non - Ferrous Metals
INR 12,719 Cr (Small Cap)
44.00
23
0.32%
-0.04
6.91%
2.86
Total Returns (Price + Dividend) 
Latest dividend: 0.05 per share ex-dividend date: Jul-02-2026
Risk Adjusted Returns v/s
Returns Beta

News
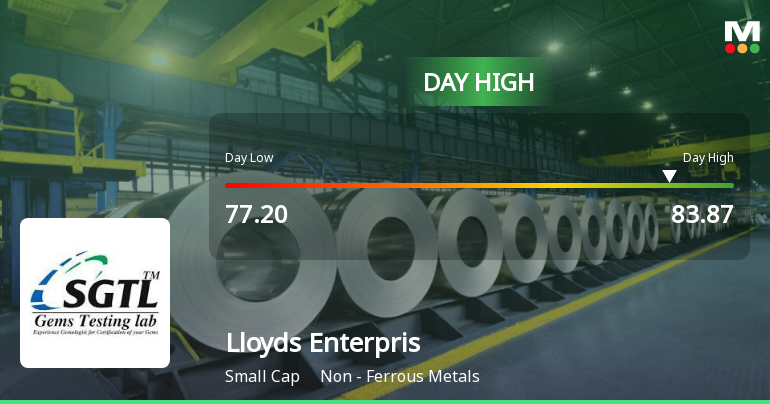
Lloyds Enterprises Ltd Surges 7.3% to Day's High of Rs 83.87 — Outperforms Sector by 6.02 Percentage Points
The Sensex declined by 0.58% on 20 Jul 2026, while Lloyds Enterprises Ltd surged 7.3%, marking a 6.02 percentage-point outperformance over its Non - Ferrous Metals sector peers. This strong single-session gain rewrites the short-term narrative for the small-cap stock, which touched an intraday high of Rs 83.87, signalling a notable shift in momentum.
Read full news article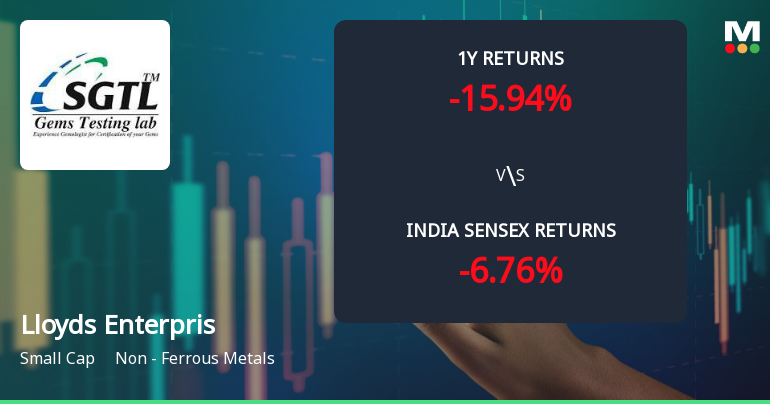
Lloyds Enterprises Ltd Sees Bullish Momentum Shift Amid Technical Upgrades
Lloyds Enterprises Ltd, a small-cap player in the Non-Ferrous Metals sector, has witnessed a notable shift in its technical momentum, upgrading its outlook from mildly bullish to bullish. This change is underpinned by positive signals from key technical indicators including MACD, Bollinger Bands, and moving averages, suggesting renewed investor confidence and potential upside in the near term.
Read full news article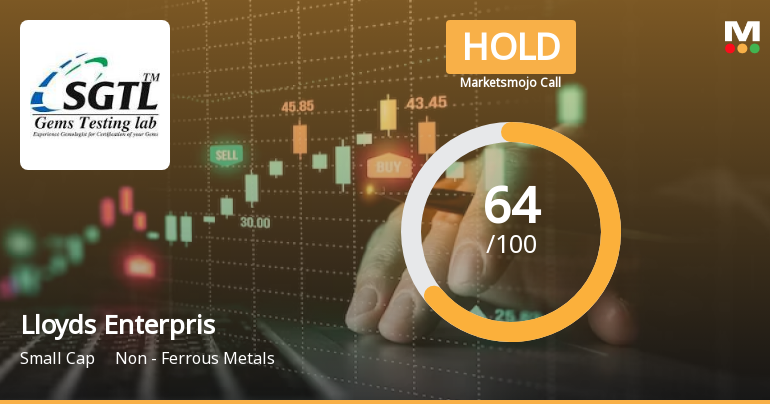
Lloyds Enterprises Ltd is Rated Hold
Lloyds Enterprises Ltd is rated 'Hold' by MarketsMOJO, with this rating last updated on 08 June 2026. However, the analysis and financial metrics discussed here reflect the stock's current position as of 12 July 2026, providing investors with an up-to-date view of the company’s performance and outlook.
Read full news article Announcements
Corporate Actions

No Upcoming Board Meetings

Lloyds Enterprises Ltd has declared 5% dividend, ex-date: 02 Jul 26

Lloyds Enterprises Ltd has announced 1:5 stock split, ex-date: 21 Dec 16

No Bonus history available

Lloyds Enterprises Ltd has announced 1:5 rights issue, ex-date: 14 Aug 25
Quality key factors
Valuation key factors
Technicals key factors
 Technical Indicator Scale: Bearish, Mildly Bearish, Sideways, Mildly Bullish, Bullish Turned
 Shareholding Snapshot : Jun 2026
Shareholding Compare (%holding)
Promoters
None
Held by 7 Schemes (0.1%)
Held by 29 FIIs (0.68%)
Blossom Trade & Interchange Llp (25.57%)
Pragya Trade Hub Private Limited (3.49%)
20.08%
Quarterly Results Snapshot (Consolidated) - Mar'26 - YoY

YoY Growth in quarter ended Mar 2026 is 47.07% vs 46.63% in Mar 2025
YoY Growth in quarter ended Mar 2026 is 304.14% vs -55.03% in Mar 2025
Half Yearly Results Snapshot (Consolidated) - Sep'25

Growth in half year ended Sep 2025 is 4.06% vs 135.77% in Sep 2024
Growth in half year ended Sep 2025 is 797.20% vs -23.32% in Sep 2024
Nine Monthly Results Snapshot (Consolidated) - Dec'25
YoY Growth in nine months ended Dec 2025 is 3.77% vs 59.90% in Dec 2024
YoY Growth in nine months ended Dec 2025 is 414.75% vs -50.66% in Dec 2024
Annual Results Snapshot (Consolidated) - Mar'26
YoY Growth in year ended Mar 2026 is 18.01% vs 55.28% in Mar 2025
YoY Growth in year ended Mar 2026 is 396.39% vs -51.43% in Mar 2025
About Lloyds Enterprises Ltd

Company Coordinates


