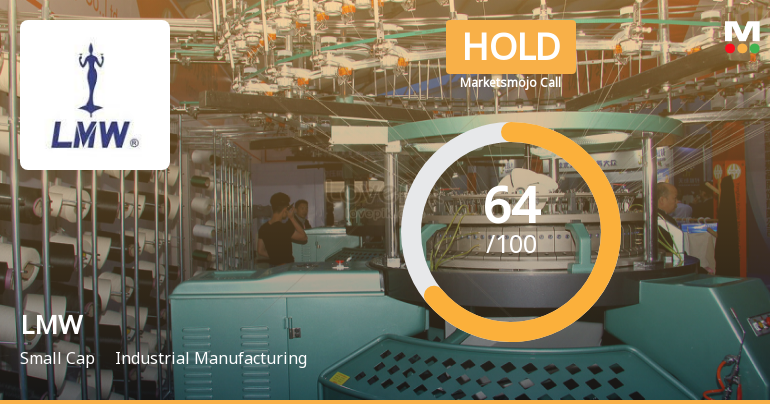
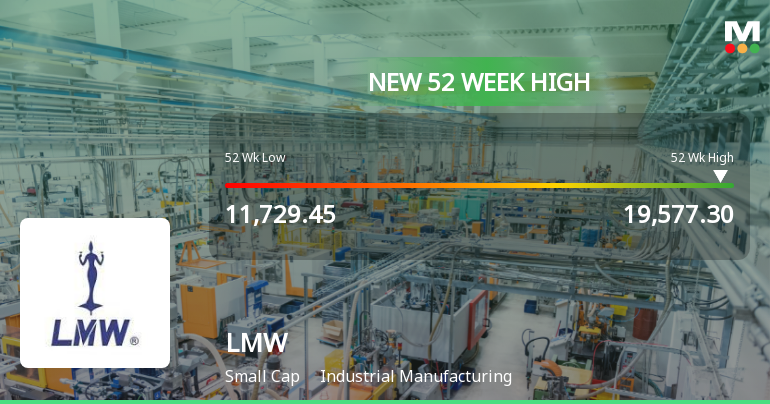
LMW

  • Market Cap: Small Cap
  • Industry: Industrial Manufacturing
  • ISIN: INE269B01029
  • NSEID: LMW
  • BSEID: 500252
INR
19,358.00
-200 (-1.02%)
BSENSE

Aug 25, 03:30 PM

BSE+NSE Vol: 2.23 k

  • Price Points
  • Score
  • Mojo Parameters
  • Total Return
  • News and Corporate Actions
  • Key factors
  • Shareholding
  • Financials
  • CompanyCV
stock-summaryPrice Point
High/Low

1Day

52 Week

Valuation
Technical
Day's Volume

CASH

2.23 k (-50.13%) Volume

Shareholding (Jun 2026)

FII

5.45%

Held by 92 FIIs

DII

9.51%

Held by 6 DIIs

Promoter

30.80%

Why is LMW Ltd falling/rising?

25-Aug-2026

As of 24-Aug, LMW Ltd's stock price is declining by 1.61%, despite strong long-term gains. The drop reflects short-term market dynamics rather than a fundamental issue with the company's outlook, as it remains net-debt-free and financially healthy.

As of 24-Aug, LMW Ltd's stock price is currently falling, as indicated by a change of -320.05, which represents a decline of 1.61%. This decrease occurs despite the stock's strong performance over the longer term, where it has shown significant gains, including a 30.40% increase year-to-date and a 28.90% rise over the past year. <BR><BR>Today's performance is in line with the sector, but there are signs of falling investor participation, as evidenced by a decrease in delivery volume by 6.73% compared to the 5-day average. Additionally, while the stock is trading above its moving averages, the proximity to its 52-week high of Rs 20,149.95 suggests that it may be experiencing some profit-taking or market correction after a strong upward trend.<BR><BR>Despite these short-term fluctuations, LMW Ltd remains a net-debt-free company with positive financial results, including substantial growth in profit before tax and profit after tax in the latest quarter. However, the current decline in stock price reflects immediate market dynamics rather than a fundamental deterioration in the company's long-term outlook.

View full answer

Who are in the management team of LMW?

14-Aug-2026

The management team of LMW includes Sanjay Jayavarthanavelu (Chairman & Managing Director), S Pathy (Director), and several independent directors such as Aditya Himatsingka and Mukund Govind Rajan, among others, totaling 11 key members with diverse expertise.

The management team of LMW includes the following individuals:<BR><BR>1. **Sanjay Jayavarthanavelu** - Chairman & Managing Director<BR>2. **S Pathy** - Director<BR>3. **Aditya Himatsingka** - Independent Director<BR>4. **Mukund Govind Rajan** - Independent Director<BR>5. **Chitra Venkataraman** - Independent Director<BR>6. **Arun Alagappan** - Independent Director<BR>7. **C R Shiv Kumaran** - Company Secretary & Compliance Officer<BR>8. **T C Suseel Kumar** - Nominee (LIC)<BR>9. **Aroon Raman** - Independent Director<BR>10. **Jaidev Jayavarthanavelu** - Director<BR>11. **M. Sankar** - Whole Time Director<BR><BR>This team brings a diverse range of expertise and leadership to the company.

View full answer

What does LMW do?

14-Aug-2026

LMW Ltd is a small-cap global manufacturer of textile machinery, established in 1962, with recent quarterly net sales of 861 Cr and a net profit of 56 Cr as of June 2026. The company has a market cap of INR 19,084 Cr and key financial metrics include a P/E ratio of 109.00 and a dividend yield of 0.20%.

Overview:<BR>LMW Ltd is a global manufacturer specializing in the production of a comprehensive range of textile machinery within the industrial manufacturing sector, categorized as a small-cap company.<BR><BR>History:<BR>LMW Ltd was incorporated on 14 September 1962, initially aimed at providing the Indian Textile Mills with advanced spinning technology. The company underwent a name change from Lakshmi Machine Works Limited to LMW Limited on 25 September 2024. The latest quarterly results reported net sales and profit for June 2026.<BR><BR>Financial Snapshot:<BR>Net Sales: 861 Cr (Quarterly Results - Jun 2026) <BR>Net Profit: 56 Cr (Quarterly Results - Jun 2026) <BR>Market Cap: INR 19,084 Cr (Small Cap)<BR><BR>Key Metrics:<BR>P/E: 109.00 <BR>Industry P/E: 57 <BR>Dividend Yield: 0.20% <BR>Debt-Equity: -0.56 <BR>Return on Equity: 4.80% <BR>Price to Book: 6.56 <BR><BR>Contact Details:<BR>Address: Perianaickenpalayam, SRK Vidyalaya Post Coimbatore Tamil Nadu : 641020 <BR>Tel: 91-422-3022255/2692371-72 <BR>Email: secretarial@lmw.co.in <BR>Website: http://www.lmwglobal.com

View full answer

Who are the peers of the LMW?

14-Aug-2026

LMW's peers include Honeywell Auto, Syrma SGS Tech, Kaynes Tech, Jyoti CNC Auto, Lloyds Engineeri, Tega Inds, Titagarh Rail, and Jupiter Wagons. Syrma SGS Tech shows the highest growth and return, while LMW has average management risk and a 1-year return of 25.87%.

Peers: The peers of LMW are Honeywell Auto, Syrma SGS Tech., Kaynes Tech, Jyoti CNC Auto., Lloyds Engineeri, Tega Inds., Titagarh Rail, and Jupiter Wagons.<BR><BR>Quality Snapshot: Excellent management risk is observed at Honeywell Auto, Tega Inds., Titagarh Rail, and Jupiter Wagons, while Average management risk is found at Syrma SGS Tech., Kaynes Tech, LMW, Lloyds Engineeri, and Jyoti CNC Auto. Below Average growth is seen in LMW, Honeywell Auto, and Jyoti CNC Auto., while Excellent growth is noted at Syrma SGS Tech. and Kaynes Tech, with the rest showing Average or Below Average growth. Excellent capital structure is attributed to Honeywell Auto, LMW, Lloyds Engineeri, and Tega Inds., while Good capital structure is found at Syrma SGS Tech. and Kaynes Tech, and Average capital structure is seen in Titagarh Rail and Jupiter Wagons.<BR><BR>Return Snapshot: Syrma SGS Tech. has the highest 1-year return at 110.58%, while Kaynes Tech has the lowest at -38.18%. LMW's 1-year return is 25.87%, which is significantly higher than Kaynes Tech but lower than Syrma SGS Tech. Additionally, Kaynes Tech and Jupiter Wagons have negative six-month returns.

View full answer

How big is LMW?

14-Aug-2026

As of 14th August, LMW Ltd has a market capitalization of 20,046.65 Cr, with net sales of 3,374.00 Cr and a net profit of 174.79 Cr reported for the latest four quarters. Shareholder's funds are 2,866.52 Cr, and total assets are 4,262.03 Cr as of March 2026.

As of 14th August, LMW Ltd has a market capitalization of 20,046.65 Cr, categorizing it as a Small Cap company.<BR><BR>In the latest four quarters, LMW Ltd reported net sales of 3,374.00 Cr and a net profit of 174.79 Cr.<BR><BR>For the latest annual period ending in March 2026, LMW Ltd's shareholder's funds amounted to 2,866.52 Cr, while total assets were reported at 4,262.03 Cr.

View full answer

Are LMW Ltd latest results good or bad?

25-Jul-2026

LMW Ltd's latest results show strong year-on-year net profit growth of 384.05% and a 24.00% revenue increase, indicating recovery; however, sequential declines in both profit and revenue, along with reliance on non-operating income, suggest caution is needed when evaluating the company's performance.

LMW Ltd's latest results present a mixed picture. On one hand, the company reported a significant year-on-year net profit growth of 384.05%, reaching ₹55.52 crores, which is impressive and indicates a strong recovery from the previous year. Additionally, revenue increased by 24.00% year-on-year to ₹860.72 crores, suggesting healthy demand in the textile machinery sector.<BR><BR>However, there are some concerning aspects. The sequential decline in both net profit and revenue—down 12.83% and 7.76% respectively from the previous quarter—indicates potential volatility in performance. The operating margin, while improved to 7.39% from a low of 1.98% a year ago, has also seen a slight decline from 7.48% in the previous quarter.<BR><BR>Moreover, LMW's heavy reliance on non-operating income, which constituted over half of its profit before tax, raises questions about the sustainability of its core operational profitability. The company's return on equity (ROE) of 9.74% is below industry standards, reflecting challenges in capital efficiency.<BR><BR>In summary, while the year-on-year growth figures are strong, the quarterly declines and reliance on non-operating income suggest that caution is warranted. Investors should weigh these factors carefully when assessing the company's performance.

View full answer

Should I buy, sell or hold LMW Ltd?

25-Jul-2026

When is the next results date for LMW Ltd?

05-May-2026

The next results date for LMW Ltd is 20 May 2026.

The next results date for LMW Ltd is scheduled for 20 May 2026.

View full answer

Is LMW technically bullish or bearish?

10-Nov-2025

As of November 7, 2025, the trend for LMW has shifted to mildly bearish, with daily moving averages and monthly Bollinger Bands indicating weakness, despite some mildly bullish signals from the weekly MACD and KST.

As of 7 November 2025, the technical trend has changed from sideways to mildly bearish. The current stance is mildly bearish, driven by the daily moving averages indicating a bearish trend and the monthly Bollinger Bands showing bearish signals. While the weekly MACD and KST are mildly bullish, the overall monthly indicators, including the MACD and moving averages, suggest weakness. The RSI shows no signals in both weekly and monthly time frames, indicating a lack of momentum. Overall, the mixed signals across different time frames reflect a cautious outlook for LMW.

View full answer

How has been the historical performance of LMW?

06-Nov-2025

LMW's historical performance shows significant declines in net sales, operating income, and profits from Mar'24 to Mar'25, with net sales dropping to 3,012.01 Cr from 4,695.86 Cr. Despite these declines, total assets remained stable, and cash and cash equivalents increased, indicating improved liquidity.

Answer:<BR>The historical performance of LMW shows significant fluctuations in key financial metrics over the past several years.<BR><BR>Breakdown:<BR>LMW's net sales decreased from 4,695.86 Cr in Mar'24 to 3,012.01 Cr in Mar'25, following a trend of high sales in the previous years, with a peak in Mar'23 at 4,719.15 Cr. Total operating income mirrored this decline, dropping to 3,012.01 Cr in Mar'25 from 4,695.86 Cr in Mar'24. The raw material cost also decreased significantly from 2,945.41 Cr in Mar'24 to 1,808.71 Cr in Mar'25, contributing to a total expenditure decline to 2,872.79 Cr in Mar'25 from 4,260.88 Cr in Mar'24. Operating profit (PBDIT) fell to 263.89 Cr in Mar'25 from 578.50 Cr in Mar'24, with a corresponding decrease in profit before tax to 151.29 Cr from 482.16 Cr. Profit after tax also saw a decline to 102.61 Cr in Mar'25 compared to 373.66 Cr in Mar'24. Despite these declines, the company's total assets remained relatively stable at 4,007.89 Cr in Mar'25, down slightly from 4,031.42 Cr in Mar'24. Cash flow from operating activities decreased to 29.00 Cr in Mar'25 from 140.00 Cr in Mar'24, while cash and cash equivalents increased to 139.00 Cr in Mar'25 from 118.00 Cr in Mar'24, indicating a slight improvement in liquidity despite the overall decline in profitability.

View full answer

Is LMW overvalued or undervalued?

09-Jun-2025

As of September 23, 2024, LMW is considered very expensive and overvalued with a PE ratio of 169.04, significantly higher than its peers, and has underperformed the Sensex with a year-to-date return of -6.96%.

As of 23 September 2024, the valuation grade for LMW has moved from expensive to very expensive, indicating a significant increase in perceived overvaluation. The company is currently assessed as overvalued, with a PE ratio of 169.04, an EV to EBITDA ratio of 112.29, and a Price to Book Value of 6.24. These figures starkly contrast with peers such as Bajaj Steel Industries, which has a PE ratio of 23.88 and a fair valuation, and Integra Engineering, also very expensive with a PE of 38.94.<BR><BR>In comparison to its peers, LMW's financial metrics suggest a substantial premium that does not align with its returns, as evidenced by a ROE of only 3.69% and a ROCE of 2.50%. The company's recent stock performance has lagged behind the Sensex, particularly year-to-date, where it has returned -6.96% compared to the Sensex's 5.65%. Overall, the data strongly supports the conclusion that LMW is overvalued in its current market position.

View full answer

Who are the top shareholders of the LMW?

06-Jun-2025

The top shareholders of LMW include Lakshmi Cargo Company Ltd with 10.08%, individual investors with 26.79%, and notable public shareholder Nemish S Shah at 5.43%. Additionally, 12 mutual fund schemes hold 2.8%, and 96 foreign institutional investors have a combined stake of 5.91%, with no pledged promoter holdings reported.

The top shareholders of LMW include Lakshmi Cargo Company Ltd, which holds the highest promoter stake at 10.08%. Additionally, individual investors collectively own 26.79% of the company. Among public shareholders, Nemish S Shah is notable with a holding of 5.43%. The company also has 12 mutual fund schemes holding a total of 2.8% and 96 foreign institutional investors (FIIs) with a combined stake of 5.91%. There are no pledged promoter holdings reported.

View full answer

Has LMW declared dividend?

06-Jun-2025

Yes, LMW Ltd has declared a 750% dividend, amounting to ₹75 per share, with an ex-date of July 24, 2024. The company has shown strong total returns over various periods, particularly in the long term, despite some short-term fluctuations.

LMW Ltd has declared a 750% dividend.<BR><BR>Dividend Details:<BR>- Percentage announced: 750%<BR>- Amount per share: 75<BR>- Ex-date: 24 Jul 24<BR><BR>Dividend Yield: 0.45%.<BR><BR>Total Returns by Period:<BR>In the last 6 months, the price return was -2.55%, with no dividend return, resulting in a total return of -2.55%.<BR><BR>Over the past year, the price return was 1.04%, with a dividend return of 0.47%, leading to a total return of 1.51%.<BR><BR>In the 2-year period, the price return was 40.49%, the dividend return was 1.35%, culminating in a total return of 41.84%.<BR><BR>For the 3-year period, the price return was 75.85%, with a dividend return of 2.53%, resulting in a total return of 78.38%.<BR><BR>In the last 4 years, the price return was 138.78%, the dividend return was 3.42%, leading to a total return of 142.2%.<BR><BR>Over the past 5 years, the price return was 493.62%, with a dividend return of 8.26%, resulting in a total return of 501.88%.<BR><BR>Overall, LMW Ltd has declared a significant dividend, and the total returns over various periods indicate strong growth, particularly in the longer term, despite some fluctuations in the short term.

View full answer
iScoreScore
Part of MojoOne Strategy
Click here to find our call on this stock
Strong Sell
Sell
Hold
Buy
Strong Buy

Dashboard

1

The company is Net-Debt Free

 
2

Poor long term growth as Net Sales has grown by an annual rate of 10.85% and Operating profit at 14.70% over the last 5 years

 
3

Positive results in Jun 26

4

With ROE of 4.8, it has a Very Expensive valuation with a 7.2 Price to Book Value

5

Majority shareholders : Non Institution

 
6

Market Beating performance in long term as well as near term

stock-summaryMojo Parameters

Mojo Parameters

Loading Valuation Snapshot...

Stock DNA

stock-summary
Industry

Industrial Manufacturing

stock-summary
Market cap

INR 20,986 Cr (Small Cap)

stock-summary
P/E

113.00

stock-summary
Industry P/E

61

stock-summary
Dividend Yield

0.18%

stock-summary
Debt Equity

-0.56

stock-summary
Return on Equity

4.80%

stock-summary
Price to Book

7.31

Revenue and Profits:
Net Sales:
861 Cr
(Quarterly Results - Jun 2026)
Net Profit:
56 Cr
stock-summaryTotal Returns
Total Returns (Price + Dividend) stock-summary
Dividend Yield (0.18%)
TimePeriod
Price Return
Dividend Return
Total Return
3 Months
30.09%
0.22%
30.31%
6 Months
24.7%
0.23%
24.93%
1 Year
27.98%
0.25%
28.23%
2 Years
25.51%
0.40%
25.91%
3 Years
43.02%
0.94%
43.96%
4 Years
64.9%
1.90%
66.8%
5 Years
151.37%
3.50%
154.87%

Latest dividend: 35 per share ex-dividend date: Jul-17-2026

Risk Adjusted Returns v/s stock-summary
Returns Beta
Icon
Beta has not been calculated since enough price history is not available
stock-summaryNews & Corporate Actions

News

LMW Ltd Gains 5.16%: Key Drivers Behind Its Resilient Rally

Announcements stock-summary

Lakshmi Machine Works Limited - Updates

14-Nov-2019 | Source : NSE

Lakshmi Machine Works Limited has informed the Exchange regarding 'Communication of information under Regulation 30 of SEBI (Listing Obligations and Disclosure Requirements) Regulations, 2015.'.

Updates

16-Aug-2019 | Source : NSE

Lakshmi Machine Works Limited has informed the Exchange regarding 'Communication of Information under Regulation 30 of SEBI (Listing Obligations and Disclosure Requirements) Regulations, 2015';.that Lakshmi Machine Works Limited, The Boeing Company and the Learning Links Foundation today announced the launch of the ??Aerospace Tool Design & Manufacturing Program?? to train students on technical skills required to work in aerospace tool manufacturing sector. This first of its kind program in Tamil Nadu, aims to further strengthen the aerospace ecosystem in the country and is in line with Government of India??s national initiative ??Skill India??.

Clarification - Financial Results

08-Aug-2019 | Source : NSE

The Exchange has sought clarification from Lakshmi Machine Works Limited for the quarter ended 30-Jun-2019 with respect to Regulation 33 of the SEBI (Listing Obligations and Disclosure Requirements) Regulations, 2015. On basis of above the Company is required to clarify the following: -1. Financial results submitted is not as per format prescribed by SEBI The response of the Company is awaited.

Corporate Actions stock-summary

stock-summary
BOARD MEETING

No Upcoming Board Meetings

stock-summary
DIVIDEND

LMW Ltd has declared 350% dividend, ex-date: 17 Jul 26

stock-summary
SPLITS

LMW Ltd has announced 10:100 stock split, ex-date: 13 Dec 06

stock-summary
BONUS

No Bonus history available

stock-summary
RIGHTS

No Rights history available

stock-summaryKey Factors

Quality key factors stock-summary

Factor
Value
Sales Growth (5y)
10.85%
EBIT Growth (5y)
14.70%
EBIT to Interest (avg)
100.00
Debt to EBITDA (avg)
Net Debt is too low
Net Debt to Equity (avg)
-0.56
Sales to Capital Employed (avg)
1.52
Tax Ratio
25.43%
Dividend Payout Ratio
28.59%
Pledged Shares
0
Institutional Holding
14.96%
ROCE (avg)
15.25%
ROE (avg)
9.74%

Valuation key factors

Factor
Value
P/E Ratio
113
Industry P/E
61
Price to Book Value
7.19
EV to EBIT
193.35
EV to EBITDA
86.81
EV to Capital Employed
15.05
EV to Sales
5.64
PEG Ratio
1.49
Dividend Yield
0.18%
ROCE (Latest)
3.88%
ROE (Latest)
4.80%

Technicals key factors

Indicator
Weekly
Monthly
MACD
Bullish
Bullish
RSI
Bearish
No Signal
Bollinger Bands
Mildly Bullish
Bullish
Moving Averages
Bullish (Daily)
KST
Bullish
Mildly Bullish
Dow Theory
No Trend
Bullish
OBV
No Trend
Mildly Bullish
stock-summary Technical Indicator Scale: Bearish, Mildly Bearish, Sideways, Mildly Bullish, Bullish  Turned 
stock-summaryShareholding
Shareholding Snapshot : Jun 2026stock-summary
Shareholding Compare (%holding) stock-summary
Majority shareholders

Non Institution

Pledged Promoter Holdings

None

Mutual Funds

Held by 7 Schemes (2.61%)

FIIs

Held by 92 FIIs (5.45%)

Promoter with highest holding

Lakshmi Cargo Company Ltd (10.08%)

Highest Public shareholder

Voltas Limited (5.43%)

Individual Investors Holdings

27.2%

stock-summaryFinancial
[
  {
    "link": "quarterly",
    "btn_text": "All Quarterly Results",
    "header": "Quarterly Results Snapshot (Consolidated) - Jun'26 - YoY",
    "rhs": [
      {
        "prefix": "Net Sales ",
        "suffix": "YoY Growth in quarter ended Jun 2026 is 24.00% vs 3.15% in Jun 2025",
        "dir": 1
      },
      {
        "prefix": "Consolidated Net Profit ",
        "suffix": "YoY Growth in quarter ended Jun 2026 is 384.05% vs 4.08% in Jun 2025",
        "dir": 1
      }
    ],
    "table": {
      "header": [
        "Jun'26",
        "Jun'25",
        "Change(%)"
      ],
      "body": [
        {
          "field": "Net Sales",
          "val1": "860.72",
          "val2": "694.14",
          "chgp": "24.00%",
          "chgp_class": "positive"
        },
        {
          "field": "Operating Profit (PBDIT) excl Other Income",
          "val1": "63.57",
          "val2": "13.75",
          "chgp": "362.33%",
          "chgp_class": "positive"
        },
        {
          "field": "Interest",
          "val1": "0.00",
          "val2": "0.00",
          "chgp": "",
          "chgp_class": "neutral"
        },
        {
          "field": "Exceptional Items",
          "val1": "-2.41",
          "val2": "-1.29",
          "chgp": "-86.82%",
          "chgp_class": "negative"
        },
        {
          "field": "Consolidate Net Profit",
          "val1": "55.52",
          "val2": "11.47",
          "chgp": "384.05%",
          "chgp_class": "positive"
        },
        {
          "field": "Operating Profit Margin (Excl OI)",
          "val1": "7.39%",
          "val2": "1.98%",
          "chgp": "5.41%",
          "chgp_class": "positive"
        }
      ]
    }
  },
  {
    "link": "half-yearly",
    "btn_text": "All Half Yearly Results",
    "header": "Half Yearly Results Snapshot (Consolidated) - Sep'25",
    "rhs": [
      {
        "prefix": "Net Sales ",
        "suffix": " Growth in half year ended Sep 2025 is 5.14% vs -42.58% in Sep 2024",
        "dir": 1
      },
      {
        "prefix": "Consolidated Net Profit ",
        "suffix": " Growth in half year ended Sep 2025 is 47.66% vs -83.02% in Sep 2024",
        "dir": 1
      }
    ],
    "table": {
      "header": [
        "Sep'25",
        "Sep'24",
        "Change(%)"
      ],
      "body": [
        {
          "field": "Net Sales",
          "val1": "1,516.02",
          "val2": "1,441.95",
          "chgp": "5.14%",
          "chgp_class": "positive"
        },
        {
          "field": "Operating Profit (PBDIT) excl Other Income",
          "val1": "57.80",
          "val2": "45.49",
          "chgp": "27.06%",
          "chgp_class": "positive"
        },
        {
          "field": "Interest",
          "val1": "0.00",
          "val2": "0.00",
          "chgp": "",
          "chgp_class": "neutral"
        },
        {
          "field": "Exceptional Items",
          "val1": "-1.29",
          "val2": "0.00",
          "chgp": "",
          "chgp_class": "neutral"
        },
        {
          "field": "Consolidate Net Profit",
          "val1": "52.39",
          "val2": "35.48",
          "chgp": "47.66%",
          "chgp_class": "positive"
        },
        {
          "field": "Operating Profit Margin (Excl OI)",
          "val1": "3.81%",
          "val2": "3.15%",
          "chgp": "0.66%",
          "chgp_class": "positive"
        }
      ]
    }
  },
  {
    "link": "nine-monthly",
    "btn_text": "All Nine Monthly Results",
    "header": "Nine Monthly Results Snapshot (Consolidated) - Dec'25",
    "rhs": [
      {
        "prefix": "Net Sales ",
        "suffix": "YoY Growth in nine months ended Dec 2025 is 2.98% vs -40.72% in Dec 2024",
        "dir": 1
      },
      {
        "prefix": "Consolidated Net Profit ",
        "suffix": "YoY Growth in nine months ended Dec 2025 is 22.40% vs -82.20% in Dec 2024",
        "dir": 1
      }
    ],
    "table": {
      "header": [
        "Dec'25",
        "Dec'24",
        "Change(%)"
      ],
      "body": [
        {
          "field": "Net Sales",
          "val1": "2,274.26",
          "val2": "2,208.38",
          "chgp": "2.98%",
          "chgp_class": "positive"
        },
        {
          "field": "Operating Profit (PBDIT) excl Other Income",
          "val1": "99.45",
          "val2": "81.25",
          "chgp": "22.40%",
          "chgp_class": "positive"
        },
        {
          "field": "Interest",
          "val1": "0.00",
          "val2": "0.00",
          "chgp": "",
          "chgp_class": "neutral"
        },
        {
          "field": "Exceptional Items",
          "val1": "-12.79",
          "val2": "0.00",
          "chgp": "",
          "chgp_class": "neutral"
        },
        {
          "field": "Consolidate Net Profit",
          "val1": "67.05",
          "val2": "54.78",
          "chgp": "22.40%",
          "chgp_class": "positive"
        },
        {
          "field": "Operating Profit Margin (Excl OI)",
          "val1": "4.37%",
          "val2": "3.68%",
          "chgp": "0.69%",
          "chgp_class": "positive"
        }
      ]
    }
  },
  {
    "link": "annual",
    "btn_text": "All Annual Results",
    "header": "Annual Results Snapshot (Consolidated) - Mar'26",
    "rhs": [
      {
        "prefix": "Net Sales ",
        "suffix": "YoY Growth in year ended Mar 2026 is 6.49% vs -35.86% in Mar 2025",
        "dir": 1
      },
      {
        "prefix": "Consolidated Net Profit ",
        "suffix": "YoY Growth in year ended Mar 2026 is 27.40% vs -72.54% in Mar 2025",
        "dir": 1
      }
    ],
    "table": {
      "header": [
        "Mar'26",
        "Mar'25",
        "Change(%)"
      ],
      "body": [
        {
          "field": "Net Sales",
          "val1": "3,207.42",
          "val2": "3,012.01",
          "chgp": "6.49%",
          "chgp_class": "positive"
        },
        {
          "field": "Operating Profit (PBDIT) excl Other Income",
          "val1": "169.23",
          "val2": "139.22",
          "chgp": "21.56%",
          "chgp_class": "positive"
        },
        {
          "field": "Interest",
          "val1": "0.00",
          "val2": "0.00",
          "chgp": "",
          "chgp_class": "neutral"
        },
        {
          "field": "Exceptional Items",
          "val1": "-13.18",
          "val2": "0.00",
          "chgp": "",
          "chgp_class": "neutral"
        },
        {
          "field": "Consolidate Net Profit",
          "val1": "130.73",
          "val2": "102.61",
          "chgp": "27.40%",
          "chgp_class": "positive"
        },
        {
          "field": "Operating Profit Margin (Excl OI)",
          "val1": "5.28%",
          "val2": "4.62%",
          "chgp": "0.66%",
          "chgp_class": "positive"
        }
      ]
    }
  }
]

Quarterly Results Snapshot (Consolidated) - Jun'26 - YoYstock-summary

Jun'26
Jun'25
Change(%)
Net Sales
860.72
694.14
24.00%
Operating Profit (PBDIT) excl Other Income
63.57
13.75
362.33%
Interest
0.00
0.00
Exceptional Items
-2.41
-1.29
-86.82%
Consolidate Net Profit
55.52
11.47
384.05%
Operating Profit Margin (Excl OI)
7.39%
1.98%
5.41%
Values in Rs Cr.
Direction Arrows
Net Sales

YoY Growth in quarter ended Jun 2026 is 24.00% vs 3.15% in Jun 2025

Direction Arrows
Consolidated Net Profit

YoY Growth in quarter ended Jun 2026 is 384.05% vs 4.08% in Jun 2025

Half Yearly Results Snapshot (Consolidated) - Sep'25stock-summary

Sep'25
Sep'24
Change(%)
Net Sales
1,516.02
1,441.95
5.14%
Operating Profit (PBDIT) excl Other Income
57.80
45.49
27.06%
Interest
0.00
0.00
Exceptional Items
-1.29
0.00
Consolidate Net Profit
52.39
35.48
47.66%
Operating Profit Margin (Excl OI)
3.81%
3.15%
0.66%
Values in Rs Cr.
Direction Arrows
Net Sales

Growth in half year ended Sep 2025 is 5.14% vs -42.58% in Sep 2024

Direction Arrows
Consolidated Net Profit

Growth in half year ended Sep 2025 is 47.66% vs -83.02% in Sep 2024

Nine Monthly Results Snapshot (Consolidated) - Dec'25stock-summary

Dec'25
Dec'24
Change(%)
Net Sales
2,274.26
2,208.38
2.98%
Operating Profit (PBDIT) excl Other Income
99.45
81.25
22.40%
Interest
0.00
0.00
Exceptional Items
-12.79
0.00
Consolidate Net Profit
67.05
54.78
22.40%
Operating Profit Margin (Excl OI)
4.37%
3.68%
0.69%
Values in Rs Cr.
Direction Arrows
Net Sales

YoY Growth in nine months ended Dec 2025 is 2.98% vs -40.72% in Dec 2024

Direction Arrows
Consolidated Net Profit

YoY Growth in nine months ended Dec 2025 is 22.40% vs -82.20% in Dec 2024

Annual Results Snapshot (Consolidated) - Mar'26stock-summary

Mar'26
Mar'25
Change(%)
Net Sales
3,207.42
3,012.01
6.49%
Operating Profit (PBDIT) excl Other Income
169.23
139.22
21.56%
Interest
0.00
0.00
Exceptional Items
-13.18
0.00
Consolidate Net Profit
130.73
102.61
27.40%
Operating Profit Margin (Excl OI)
5.28%
4.62%
0.66%
Values in Rs Cr.
Direction Arrows
Net Sales

YoY Growth in year ended Mar 2026 is 6.49% vs -35.86% in Mar 2025

Direction Arrows
Consolidated Net Profit

YoY Growth in year ended Mar 2026 is 27.40% vs -72.54% in Mar 2025

stock-summaryCompany CV
About LMW Ltd stock-summary
stock-summary
LMW Ltd
Small Cap
Industrial Manufacturing
LMW Limited was initially incorporated on 14 September, 1962 to provide the Indian Textile Mills with the latest Spinning Technology. The name of the Company was changed to Lakshmi Machine Works Limited and further to LMW Limited dated September 25, 2024. Company is a global player and one among the 3 manufacturers of the entire range of textile machinery.
Company Coordinates stock-summary
Company Details
Perianaickenpalayam, SRK Vidyalaya Post Coimbatore Tamil Nadu : 641020
stock-summary
Tel: 91-422-3022255/2692371-72
stock-summary
secretarial@lmw.co.in
Registrar Details
SKDC Consultants Ltd , Kanapathy Towers, 3rd Floor, Ganapathy, Coimbatore