
Compare LMW with Similar Stocks
Dashboard
With ROE of 4.8, it has a Very Expensive valuation with a 5.9 Price to Book Value
- The stock is trading at a premium compared to its peers' average historical valuations
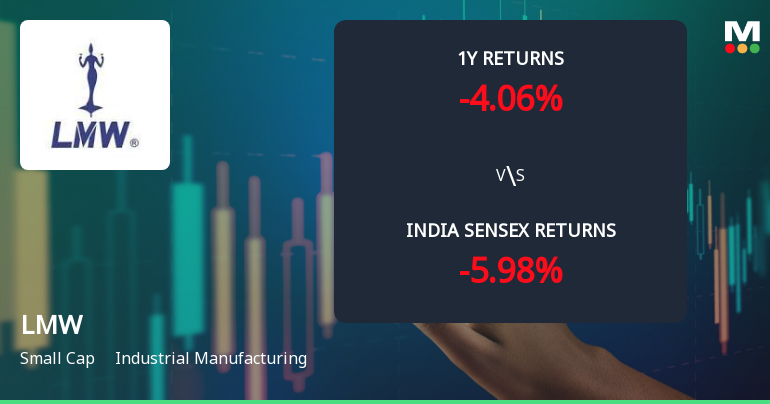
- Over the past year, while the stock has generated a return of -2.06%, its profits have risen by 34% ; the PEG ratio of the company is 3.6
Consistent Underperformance against the benchmark over the last 3 years
Stock DNA
Industrial Manufacturing
INR 16,917 Cr (Small Cap)
123.00
87
0.19%
-0.56
4.80%
5.90
Total Returns (Price + Dividend) 
Latest dividend: 30 per share ex-dividend date: Jul-10-2025
Risk Adjusted Returns v/s
Returns Beta

News
LMW Ltd Technical Momentum Shifts Amid Mixed Indicator Signals
LMW Ltd, a small-cap player in the industrial manufacturing sector, has experienced a subtle shift in its technical momentum, moving from a sideways trend to a mildly bearish stance. Despite a modest day gain of 0.24%, the stock’s technical indicators present a complex picture, with bullish signals on some weekly and monthly charts contrasting with mildly bearish daily moving averages and Dow Theory assessments. This nuanced technical landscape warrants a detailed analysis for investors seeking clarity on LMW’s near-term prospects.
Read full news article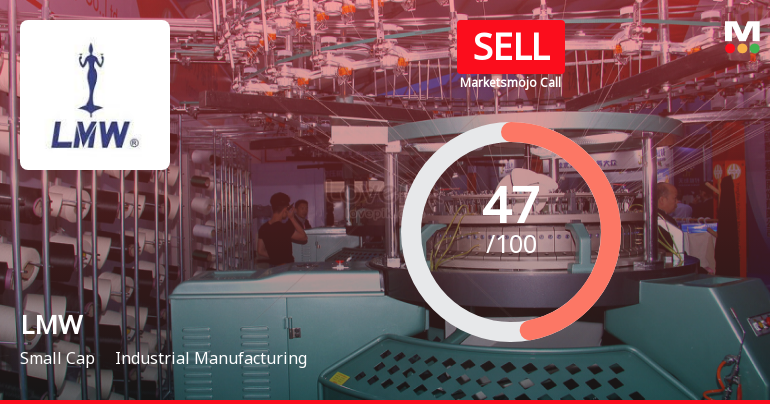
LMW Ltd is Rated Sell by MarketsMOJO
LMW Ltd is rated 'Sell' by MarketsMOJO, a rating that was last updated on 06 Nov 2025. However, the analysis and financial metrics discussed here reflect the company’s current position as of 13 June 2026, providing investors with an up-to-date perspective on the stock’s fundamentals, valuation, financial trends, and technical outlook.
Read full news article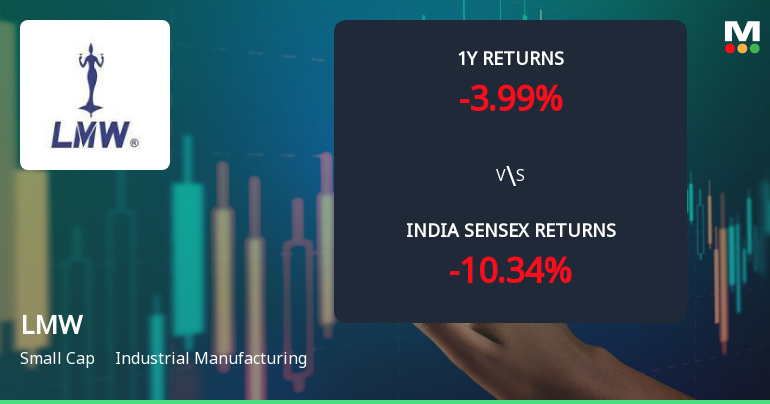
LMW Ltd Technical Momentum Shifts Amid Mixed Indicator Signals
LMW Ltd, a small-cap player in the industrial manufacturing sector, has exhibited a notable shift in its technical momentum, moving from a mildly bearish stance to a sideways trend. Despite a modest day gain of 0.62%, the stock’s technical indicators present a complex picture, with bullish signals on weekly MACD and KST counterbalanced by mildly bearish monthly trends and daily moving averages. This nuanced technical landscape warrants a detailed analysis for investors seeking clarity on LMW’s near-term prospects.
Read full news article Announcements
Intimation Under Regulation 30 Of SEBI (Listing Obligations And Disclosure Requirements) Regulations 2015
12-Jun-2026 | Source : BSEIntimation under Regulation 30 of SEBI(LODR) Regulations 2015.
Announcement under Regulation 30 (LODR)-Newspaper Publication
08-Jun-2026 | Source : BSEWe enclose herewith the copies of the newspaper advertisement published by the Company regarding the Notice to Shareholders and General Communication on Tax Deduction at Source on Dividend.
Announcement under Regulation 30 (LODR)-Newspaper Publication
05-Jun-2026 | Source : BSENewspaper Advertisement regarding Notice of Special Window for Transfer and Dematerialisation of Physical Securities.
Corporate Actions

No Upcoming Board Meetings

LMW Ltd has declared 350% dividend, ex-date: 17 Jul 26

LMW Ltd has announced 10:100 stock split, ex-date: 13 Dec 06

No Bonus history available

No Rights history available
Quality key factors
Valuation key factors
Technicals key factors
 Technical Indicator Scale: Bearish, Mildly Bearish, Sideways, Mildly Bullish, Bullish Turned
 Shareholding Snapshot : Mar 2026
Shareholding Compare (%holding)
Non Institution
None
Held by 7 Schemes (2.66%)
Held by 93 FIIs (5.54%)
Lakshmi Cargo Company Ltd (10.08%)
Voltas Limited (5.43%)
27.05%
Quarterly Results Snapshot (Consolidated) - Mar'26 - YoY

YoY Growth in quarter ended Mar 2026 is 16.12% vs -17.21% in Mar 2025
YoY Growth in quarter ended Mar 2026 is 33.19% vs -27.52% in Mar 2025
Half Yearly Results Snapshot (Consolidated) - Sep'25
Growth in half year ended Sep 2025 is 5.14% vs -42.58% in Sep 2024
Growth in half year ended Sep 2025 is 47.66% vs -83.02% in Sep 2024
Nine Monthly Results Snapshot (Consolidated) - Dec'25
YoY Growth in nine months ended Dec 2025 is 2.98% vs -40.72% in Dec 2024
YoY Growth in nine months ended Dec 2025 is 22.40% vs -82.20% in Dec 2024
Annual Results Snapshot (Consolidated) - Mar'26
YoY Growth in year ended Mar 2026 is 6.49% vs -35.86% in Mar 2025
YoY Growth in year ended Mar 2026 is 27.40% vs -72.54% in Mar 2025
About LMW Ltd

Company Coordinates


