Lokesh Mach.

  • Market Cap: Micro Cap
  • Industry: Industrial Manufacturing
  • ISIN: INE397H01017
  • NSEID: LOKESHMACH
  • BSEID: 532740
INR
359.00
-5.6 (-1.54%)
BSENSE

Sep 07, 03:08 PM

BSE+NSE Vol: 52.88 k

  • Price Points
  • Score
  • Mojo Parameters
  • Total Return
  • News and Corporate Actions
  • Key factors
  • Shareholding
  • Financials
  • CompanyCV
stock-summaryPrice Point
High/Low

1Day

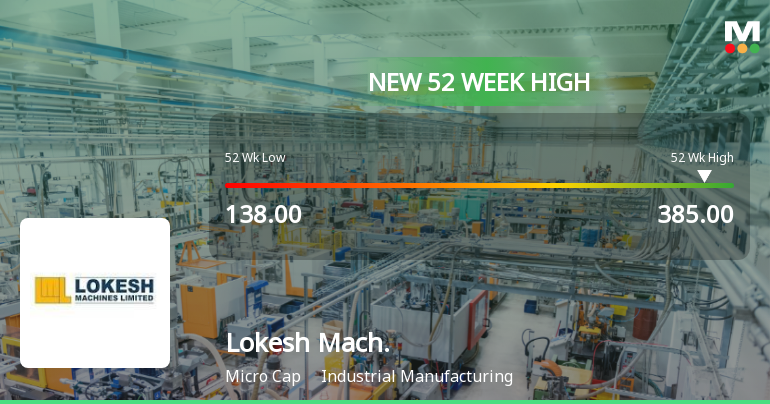
52 Week

Valuation
Technical
Day's Volume

CASH

52.88 k (-63.49%) Volume

Shareholding (Jul 2026)

FII

0.00%

Held by 0 FIIs

DII

0.00%

Held by 0 DIIs

Promoter

49.17%

Why is Lokesh Machines Ltd falling/rising?

06-Sep-2026

As of 05-Sep, Lokesh Machines Ltd's stock price is 364.20, reflecting a 1.08% increase. The stock has significantly outperformed the Sensex, with a year-to-date gain of 123.78% and strong investor interest indicated by a 147.21% rise in delivery volume.

As of 05-Sep, Lokesh Machines Ltd is experiencing a rise in its stock price, currently at 364.20, which reflects an increase of 3.9 or 1.08%. This upward movement is supported by several key factors. Over the past week, the stock has outperformed the benchmark Sensex, gaining 16.56% compared to a decline of 0.97% in the index. Additionally, the stock has shown a robust performance over the last month with a rise of 10.05%, while the Sensex fell by 2.44%.<BR><BR>Year-to-date, Lokesh Machines Ltd has achieved an impressive increase of 123.78%, significantly outperforming the Sensex, which has declined by 10.21% during the same period. The stock's performance over the past year also reflects a strong upward trend, with a gain of 79.81% against a 5.21% drop in the Sensex.<BR><BR>Today's trading activity indicates a positive sentiment, as the stock opened with a gain of 5.45% and reached an intraday high of Rs 379.95. It has been gaining for the last two days, accumulating a total return of 7.13% in this period. Furthermore, the stock is trading above its 5-day, 20-day, 50-day, 100-day, and 200-day moving averages, indicating a strong bullish trend.<BR><BR>Investor participation has also increased, with delivery volume rising by 147.21% compared to the 5-day average, suggesting heightened interest in the stock. Overall, these factors contribute to the rising price of Lokesh Machines Ltd.

View full answer

Who are in the management team of Lokesh Mach.?

01-Sep-2026

The management team of Lokesh Mach includes Mullapudi Lokeswara Rao (Managing Director), K Krishna Swamy (Director - Technical), B Kishore Babu, M Srinivas, and M Srikrishna (Whole-time Directors), along with several Non-Executive & Independent Directors and a Company Secretary. They oversee the company's operations and strategic direction.

The management team of Lokesh Mach includes the following individuals:<BR><BR>1. Mullapudi Lokeswara Rao - Managing Director<BR>2. K Krishna Swamy - Director (Technical)<BR>3. B Kishore Babu - Whole-time Director<BR>4. M Srinivas - Whole-time Director<BR>5. M Srikrishna - Whole-time Director<BR>6. B R Mahesh - Non-Executive & Independent Director<BR>7. R Mohan Reddy - Non-Executive & Independent Director<BR>8. D Balaji - Non-Executive & Independent Director<BR>9. Likhitha Mullapudi - Additional Non-Executive & Independent Director<BR>10. Gurprit Singh - Company Secretary<BR>11. S S Raman - Independent Director<BR><BR>This team is responsible for overseeing the operations and strategic direction of the company.

View full answer

What does Lokesh Mach. do?

01-Sep-2026

Lokesh Machines Ltd specializes in manufacturing machine tools and auto components, operating as a micro-cap company with a market cap of INR 789 Cr. As of June 2026, it reported net sales of 55 Cr and a net profit of 1 Cr.

Overview: <BR>Lokesh Machines Ltd is a specialist in manufacturing machine tools and auto components, operating within the industrial manufacturing sector and classified as a micro-cap company.<BR><BR>History: <BR>Established in December 1983, Lokesh Machines Ltd commenced operations in 1985. The latest financial results reported are for the quarter ending June 2026, showing net sales and profit figures.<BR><BR>Financial Snapshot: <BR>Net Sales: 55 Cr (Quarterly Results - Jun 2026) <BR>Net Profit: 1 Cr (Quarterly Results - Jun 2026) <BR>Market Cap: INR 789 Cr (Micro Cap)<BR><BR>Key Metrics: <BR>P/E: 171.00 <BR>Industry P/E: 35 <BR>Dividend Yield: 0.00% <BR>Debt-Equity: 0.67 <BR>Return on Equity: 1.96% <BR>Price to Book: 3.02<BR><BR>Contact Details: <BR>Address: B-29 EEIE Stage-II, Balanagar Hyderabad Telangana : 500037 <BR>Tel: 91-40-23079310-23079313 <BR>Email: investorinfo@lokeshmachines.com <BR>Website: http://www.lokeshmachines.com

View full answer

Who are the peers of the Lokesh Mach.?

01-Sep-2026

Peers of Lokesh Mach. include Sunita Tools Ltd, Captain Techno., Axtel Industries, Integra Engg., Artson, Tankup Engi., OSEL Devices, and Ganesh Green. Lokesh Mach. has Below Average growth and capital structure, with a 1-year return of 68.68%, outperforming Axtel Industries, which has the lowest return at -17.54%.

Peers: The peers of Lokesh Mach. are Sunita Tools Ltd, Captain Techno., Axtel Industries, Integra Engg., Artson, Tankup Engi., OSEL Devices, and Ganesh Green.<BR><BR>Quality Snapshot: Excellent management risk is observed at Captain Techno. and the rest have Average management risk, including Sunita Tools Ltd, Axtel Industries, Integra Engg., Artson, Tankup Engi., OSEL Devices, and Ganesh Green. Growth is Excellent at Sunita Tools Ltd, Tankup Engi., OSEL Devices, and Ganesh Green, while Good growth is found at Captain Techno., and the rest have Below Average growth, including Lokesh Mach., Axtel Industries, Integra Engg., Artson. Capital Structure is Excellent at Axtel Industries and Integra Engg., Good at Sunita Tools Ltd and Captain Techno., and Below Average at Lokesh Mach., Artson, Tankup Engi., OSEL Devices, and Ganesh Green.<BR><BR>Return Snapshot: Sunita Tools Ltd has the highest 1-year return at 59.36%, while Axtel Industries has the lowest at -17.54%. Lokesh Mach.'s 1-year return of 68.68% is higher than both. Additionally, Axtel Industries, Integra Engg., Artson, and Ganesh Green have negative six-month returns.

View full answer

How big is Lokesh Mach.?

01-Sep-2026

As of 31st August, Lokesh Machines Ltd has a market capitalization of 789.00 Cr, with recent net sales of 215.98 Cr and a net profit of 4.42 Cr. The company reported shareholder's funds of 212.82 Cr and total assets of 427.87 Cr for the latest annual period ending in March 2025.

As of 31st August, Lokesh Machines Ltd has a market capitalization of 789.00 Cr and is classified as a Micro Cap company.<BR><BR>In the latest four quarters, Lokesh Machines Ltd reported Net Sales of 215.98 Cr and a Net Profit of 4.42 Cr.<BR><BR>For the latest annual period ending in March 2025, the company had Shareholder's Funds of 212.82 Cr and Total Assets amounting to 427.87 Cr.

View full answer

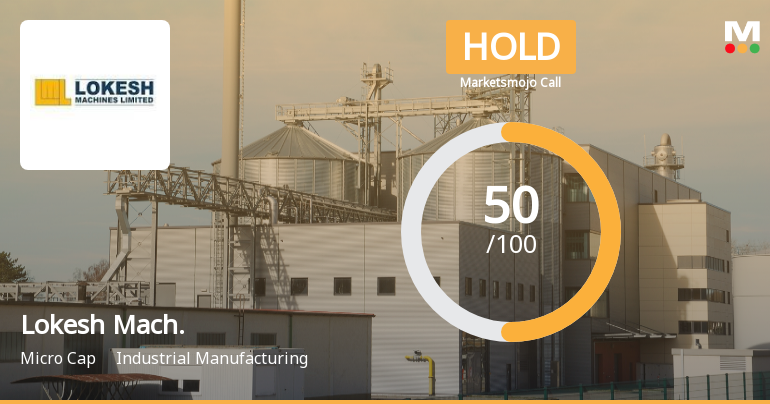
Should I buy, sell or hold Lokesh Machines Ltd?

01-Sep-2026

When is the next results date for Lokesh Machines Ltd?

06-Aug-2026

The next results date for Lokesh Machines Ltd is 12 August 2026.

The next results date for Lokesh Machines Ltd is scheduled for 12 August 2026.

View full answer

Are Lokesh Machines Ltd latest results good or bad?

27-May-2026

Lokesh Machines Ltd's latest Q4 FY26 results show strong revenue and profit growth, with a net profit of ₹2.15 crore and a 241.27% increase quarter-on-quarter. However, declining profit margins and low return ratios raise concerns about the sustainability of this performance.

Lokesh Machines Ltd's latest results for Q4 FY26 present a mixed picture. On the positive side, the company achieved a remarkable net profit of ₹2.15 crore, reflecting a substantial increase of 241.27% quarter-on-quarter and an impressive 1553.85% year-on-year growth. Additionally, the revenue reached ₹59.36 crore, marking a strong sequential growth of 17.01% and a year-on-year increase of 53.42%. This indicates robust order execution and market traction, with the highest quarterly revenue in the company's recent history.<BR><BR>However, there are concerns regarding the sustainability of profit margins. The operating margin decreased to 17.69%, down 110 basis points from the previous quarter and 120 basis points year-on-year. This suggests that while revenue is growing, operational efficiency is under pressure. The net profit margin of 3.62% is improved from the previous quarter but still below the levels seen in earlier periods.<BR><BR>Moreover, the company faces challenges with return ratios, as the return on equity (ROE) has significantly declined to 0.82%, and return on capital employed (ROCE) is at a low 3.09%. This indicates that the company is struggling to generate adequate returns relative to its capital employed.<BR><BR>In summary, while Lokesh Machines Ltd has demonstrated impressive revenue and profit growth, the declining margins and weak return ratios raise questions about the sustainability of this performance. Investors should monitor these trends closely moving forward.

View full answer

How has been the historical performance of Lokesh Mach.?

12-Nov-2025

Lokesh Mach. experienced fluctuating financial performance, with net sales declining to 228.32 Cr in Mar'25 from 293.54 Cr in Mar'24, and profit after tax dropping to 0.54 Cr from 13.85 Cr. Despite these challenges, total assets increased to 427.87 Cr, and cash flow from operating activities improved to 20.00 Cr.

Answer:<BR>The historical performance of Lokesh Mach. shows a fluctuating trend in key financial metrics over the years.<BR><BR>Breakdown:<BR>Lokesh Mach. reported net sales of 228.32 Cr in Mar'25, a decline from 293.54 Cr in Mar'24 and an increase from 240.30 Cr in Mar'23. The total operating income followed a similar pattern, reaching 228.32 Cr in Mar'25, down from 293.54 Cr in Mar'24. The raw material cost decreased to 134.55 Cr in Mar'25 from 171.15 Cr in Mar'24, while total expenditure (excluding depreciation) also fell to 199.86 Cr in Mar'25 from 253.22 Cr in Mar'24. Operating profit (PBDIT) decreased to 29.93 Cr in Mar'25 from 42.00 Cr in Mar'24, leading to a profit before tax of 0.89 Cr in Mar'25, significantly lower than 20.55 Cr in Mar'24. Profit after tax also saw a decline to 0.54 Cr in Mar'25 from 13.85 Cr in Mar'24. The company's total assets increased to 427.87 Cr in Mar'25 from 390.58 Cr in Mar'24, while total liabilities rose to 427.87 Cr from 390.58 Cr in the same period. Cash flow from operating activities improved to 20.00 Cr in Mar'25 from 17.00 Cr in Mar'24, but cash flow from investing activities worsened to -37.00 Cr from -59.00 Cr. Overall, Lokesh Mach. experienced a challenging year in terms of profitability while managing to increase its asset base.

View full answer

Is Lokesh Mach. overvalued or undervalued?

09-Jun-2025

As of June 4, 2025, Lokesh Mach. is considered overvalued with a high PE ratio of 310.57 and low returns on capital and equity, despite having outperformed the Sensex over five years, but significantly underperformed year-to-date with a return of -47.36%.

As of 4 June 2025, the valuation grade for Lokesh Mach. has moved from very attractive to attractive, indicating a shift in perception regarding its value. The company appears to be overvalued, especially given its high PE ratio of 310.57, which significantly exceeds the industry average. Additionally, the EV to EBITDA ratio stands at 15.28, while the ROCE and ROE are notably low at 4.33% and 0.25%, respectively, suggesting inefficiencies in generating returns relative to its capital and equity.<BR><BR>In comparison to its peers, Lokesh Mach. has a substantially higher PE ratio than Rail Vikas, which is at 69.76, and AIA Engineering at 31.18, both categorized as very expensive. The PEG ratio of 0.00 further emphasizes the lack of growth expectations priced into the stock. Recent performance shows that while Lokesh Mach. has outperformed the Sensex over a 5-year period, it has drastically underperformed in the short term, with a year-to-date return of -47.36% compared to the Sensex's 5.64%. This combination of high valuation ratios and poor recent performance reinforces the conclusion of overvaluation.

View full answer

What is the technical trend for Lokesh Mach.?

09-Jun-2025

As of May 12, 2025, Lokesh Mach's trend is mildly bearish, with mixed signals from MACD and RSI, bearish moving averages and Bollinger Bands, and a mildly bullish KST, indicating short-term weakness despite some potential for upward momentum.

As of 12 May 2025, the technical trend for Lokesh Mach has changed from bearish to mildly bearish. The weekly MACD is mildly bullish, while the monthly MACD remains bearish, indicating mixed signals. The RSI shows no signal on the weekly chart but is bullish on the monthly, suggesting potential upward momentum over a longer time frame. However, Bollinger Bands are bearish on both weekly and monthly charts, reinforcing a cautious outlook. Daily moving averages are bearish, which adds to the short-term weakness. The KST indicates a mildly bullish stance weekly but mildly bearish monthly, further complicating the overall picture. Dow Theory reflects a mildly bearish trend on the weekly chart with no trend on the monthly. Overall, the current stance is mildly bearish, driven primarily by the bearish moving averages and Bollinger Bands, despite some bullish signals in the MACD and RSI.

View full answer

Who are the top shareholders of the Lokesh Mach.?

06-Jun-2025

The top shareholders of Lokesh Mach. include promoters, with Srinivas Mullapudi holding the largest stake at 12.54%, while individual investors own 41.45%. Promoters have also pledged 8.001% of their holdings, and there are no mutual funds or foreign institutional investors involved.

The top shareholders of Lokesh Mach. are primarily the promoters, with Srinivas Mullapudi holding the highest individual stake at 12.54%. Additionally, individual investors collectively own 41.45% of the company. There are no mutual funds or foreign institutional investors currently holding shares in Lokesh Mach. Furthermore, the promoters have pledged 8.001% of their holdings.

View full answer

Has Lokesh Mach. declared dividend?

06-Jun-2025

Yes, Lokesh Machines Ltd has declared a dividend of 5% (0.5 per share) with an ex-date of September 22, 2016. However, the dividend yield is 0%, and recent total returns have shown significant fluctuations, with a total return of -57.13% over the last 6 months.

Yes, Lokesh Machines Ltd has declared a dividend.<BR><BR>Dividend Details:<BR>- Percentage announced: 5%<BR>- Amount per share: 0.5<BR>- Ex-date: 22 Sep 16<BR><BR>Dividend Yield: 0%<BR><BR>Total Returns by Period:<BR>In the last 6 months, the price return was -57.13%, the dividend return was 0%, resulting in a total return of -57.13%.<BR><BR>Over the past year, the price return was -60.19%, with a dividend return of 0%, leading to a total return of -60.19%.<BR><BR>In the 2-year period, the price return was 3.56%, the dividend return remained at 0%, resulting in a total return of 3.56%.<BR><BR>For the 3-year period, the price return was 100.89%, with a dividend return of 0%, culminating in a total return of 100.89%.<BR><BR>In the 4-year period, the price return was 252.67%, and the dividend return was 0%, giving a total return of 252.67%.<BR><BR>Over the last 5 years, the price return was 737.47%, with a dividend return of 0%, resulting in a total return of 737.47%.<BR><BR>Overall, while Lokesh Machines Ltd has declared a dividend, the dividend yield is 0%, indicating no recent dividends have been paid out. The total returns show significant fluctuations, particularly a strong performance over the longer term despite recent negative price returns.

View full answer
iScoreScore
Click here to find our call on this stock
Strong Sell
Sell
Hold
Buy
Strong Buy

Dashboard

1

Weak Long Term Fundamental Strength with an average Return on Capital Employed (ROCE) of 7.86%

  • Poor long term growth as Net Sales has grown by an annual rate of 5.35% and Operating profit at 4.48% over the last 5 years
  • Low ability to service debt as the company has a high Debt to EBITDA ratio of 6.06 times
2

The company has declared Positive results for the last 3 consecutive quarters

3

With ROCE of 3.1, it has a Very Expensive valuation with a 2.5 Enterprise value to Capital Employed

4

Market Beating performance in long term as well as near term

stock-summaryMojo Parameters

Mojo Parameters

Loading Valuation Snapshot...

Stock DNA

stock-summary
Industry

Industrial Manufacturing

stock-summary
Market cap

INR 783 Cr (Micro Cap)

stock-summary
P/E

179.00

stock-summary
Industry P/E

35

stock-summary
Dividend Yield

0.00%

stock-summary
Debt Equity

0.67

stock-summary
Return on Equity

1.96%

stock-summary
Price to Book

3.50

Revenue and Profits:
Net Sales:
55 Cr
(Quarterly Results - Jun 2026)
Net Profit:
1 Cr
stock-summaryTotal Returns
Total Returns (Price + Dividend) stock-summary
Dividend Yield (0%)
TimePeriod
Price Return
Dividend Return
Total Return
3 Months
43.49%
0%
43.49%
6 Months
74.6%
0%
74.6%
1 Year
77.43%
0%
77.43%
2 Years
-13.35%
0%
-13.35%
3 Years
96.98%
0%
96.98%
4 Years
166.52%
0%
166.52%
5 Years
689.01%
0%
689.01%

Latest dividend: 0.5 per share ex-dividend date: Sep-22-2016

Risk Adjusted Returns v/s stock-summary
Returns Beta
Icon
Beta has not been calculated since enough price history is not available
stock-summaryNews & Corporate Actions

News

Announcements stock-summary

Lokesh Machines Limited - Outcome of Board Meeting

13-Nov-2019 | Source : NSE

Lokesh Machines Limited has informed the Exchange regarding Board meeting held on November 12, 2019.

AGM\/Book Closure

03-Sep-2019 | Source : NSE

Lokesh Machines Limited has informed the Exchange that the Register of Members & Share Transfer Books of the Company will remain closed from September 21, 2019 to September 27, 2019 (both days inclusive) for the purpose of Annual General Meeting.

Shareholders meeting

31-Aug-2019 | Source : NSE

Lokesh Machines Limited has informed the Exchange regarding Notice of Annual General Meeting to be held on September 27, 2019

Corporate Actions stock-summary

stock-summary
BOARD MEETING

No Upcoming Board Meetings

stock-summary
DIVIDEND

Lokesh Machines Ltd has declared 5% dividend, ex-date: 22 Sep 16

stock-summary
SPLITS

No Splits history available

stock-summary
BONUS

No Bonus history available

stock-summary
RIGHTS

No Rights history available

stock-summaryKey Factors

Quality key factors stock-summary

Factor
Value
Sales Growth (5y)
5.35%
EBIT Growth (5y)
4.48%
EBIT to Interest (avg)
1.66
Debt to EBITDA (avg)
3.55
Net Debt to Equity (avg)
0.67
Sales to Capital Employed (avg)
0.82
Tax Ratio
26.54%
Dividend Payout Ratio
0
Pledged Shares
15.33%
Institutional Holding
0
ROCE (avg)
7.80%
ROE (avg)
4.37%

Valuation key factors

Factor
Value
P/E Ratio
179
Industry P/E
35
Price to Book Value
3.50
EV to EBIT
39.92
EV to EBITDA
23.95
EV to Capital Employed
2.50
EV to Sales
4.35
PEG Ratio
0.03
Dividend Yield
NA
ROCE (Latest)
3.09%
ROE (Latest)
1.96%

Technicals key factors

Indicator
Weekly
Monthly
MACD
Bullish
Bullish
RSI
No Signal
No Signal
Bollinger Bands
Bullish
Bullish
Moving Averages
Bullish (Daily)
KST
Bullish
Bullish
Dow Theory
Mildly Bullish
Mildly Bullish
OBV
Bullish
Bullish
stock-summary Technical Indicator Scale: Bearish, Mildly Bearish, Sideways, Mildly Bullish, Bullish  Turned 
stock-summaryShareholding
Shareholding Snapshot : Jul 2026stock-summary
Shareholding Compare (%holding) stock-summary
Majority shareholders

Non Institution

Pledged Promoter Holdings

15.3296

Mutual Funds

Held by 0 Schemes

FIIs

Held by 0 FIIs

Promoter with highest holding

Srinivas Mullapudi (12.28%)

Highest Public shareholder

Zenila Ventures Llp (2.82%)

Individual Investors Holdings

41.87%

stock-summaryFinancial
[
  {
    "link": "quarterly",
    "btn_text": "All Quarterly Results",
    "header": "Quarterly Results Snapshot (Standalone) - Jun'26 - QoQ",
    "rhs": [
      {
        "prefix": "Net Sales ",
        "suffix": "QoQ Growth in quarter ended Jun 2026 is -6.57% vs 17.01% in Mar 2026",
        "dir": -1
      },
      {
        "prefix": "Standalone Net Profit ",
        "suffix": "QoQ Growth in quarter ended Jun 2026 is -53.02% vs 241.27% in Mar 2026",
        "dir": -1
      }
    ],
    "table": {
      "header": [
        "Jun'26",
        "Mar'26",
        "Change(%)"
      ],
      "body": [
        {
          "field": "Net Sales",
          "val1": "55.46",
          "val2": "59.36",
          "chgp": "-6.57%",
          "chgp_class": "negative"
        },
        {
          "field": "Operating Profit (PBDIT) excl Other Income",
          "val1": "9.61",
          "val2": "10.50",
          "chgp": "-8.48%",
          "chgp_class": "negative"
        },
        {
          "field": "Interest",
          "val1": "4.65",
          "val2": "4.22",
          "chgp": "10.19%",
          "chgp_class": "negative"
        },
        {
          "field": "Exceptional Items",
          "val1": "0.00",
          "val2": "0.00",
          "chgp": "",
          "chgp_class": "neutral"
        },
        {
          "field": "Standalone Net Profit",
          "val1": "1.01",
          "val2": "2.15",
          "chgp": "-53.02%",
          "chgp_class": "negative"
        },
        {
          "field": "Operating Profit Margin (Excl OI)",
          "val1": "17.33%",
          "val2": "17.69%",
          "chgp": "-0.36%",
          "chgp_class": "negative"
        }
      ]
    }
  },
  {
    "link": "half-yearly",
    "btn_text": "All Half Yearly Results",
    "header": "Half Yearly Results Snapshot (Standalone) - Sep'25",
    "rhs": [
      {
        "prefix": "Net Sales ",
        "suffix": " Growth in half year ended Sep 2025 is -28.55% vs 8.78% in Sep 2024",
        "dir": -1
      },
      {
        "prefix": "Standalone Net Profit ",
        "suffix": " Growth in half year ended Sep 2025 is -76.11% vs 11.60% in Sep 2024",
        "dir": -1
      }
    ],
    "table": {
      "header": [
        "Sep'25",
        "Sep'24",
        "Change(%)"
      ],
      "body": [
        {
          "field": "Net Sales",
          "val1": "98.48",
          "val2": "137.84",
          "chgp": "-28.55%",
          "chgp_class": "negative"
        },
        {
          "field": "Operating Profit (PBDIT) excl Other Income",
          "val1": "18.23",
          "val2": "20.17",
          "chgp": "-9.62%",
          "chgp_class": "negative"
        },
        {
          "field": "Interest",
          "val1": "9.41",
          "val2": "7.47",
          "chgp": "25.97%",
          "chgp_class": "negative"
        },
        {
          "field": "Exceptional Items",
          "val1": "0.00",
          "val2": "0.00",
          "chgp": "",
          "chgp_class": "neutral"
        },
        {
          "field": "Standalone Net Profit",
          "val1": "1.08",
          "val2": "4.52",
          "chgp": "-76.11%",
          "chgp_class": "negative"
        },
        {
          "field": "Operating Profit Margin (Excl OI)",
          "val1": "18.51%",
          "val2": "14.63%",
          "chgp": "3.88%",
          "chgp_class": "positive"
        }
      ]
    }
  },
  {
    "link": "nine-monthly",
    "btn_text": "All Nine Monthly Results",
    "header": "Nine Monthly Results Snapshot (Standalone) - Dec'25",
    "rhs": [
      {
        "prefix": "Net Sales ",
        "suffix": "YoY Growth in nine months ended Dec 2025 is -21.32% vs -11.06% in Dec 2024",
        "dir": -1
      },
      {
        "prefix": "Standalone Net Profit ",
        "suffix": "YoY Growth in nine months ended Dec 2025 is 307.14% vs -95.41% in Dec 2024",
        "dir": 1
      }
    ],
    "table": {
      "header": [
        "Dec'25",
        "Dec'24",
        "Change(%)"
      ],
      "body": [
        {
          "field": "Net Sales",
          "val1": "149.21",
          "val2": "189.63",
          "chgp": "-21.32%",
          "chgp_class": "negative"
        },
        {
          "field": "Operating Profit (PBDIT) excl Other Income",
          "val1": "27.76",
          "val2": "21.15",
          "chgp": "31.25%",
          "chgp_class": "positive"
        },
        {
          "field": "Interest",
          "val1": "14.16",
          "val2": "11.30",
          "chgp": "25.31%",
          "chgp_class": "negative"
        },
        {
          "field": "Exceptional Items",
          "val1": "0.00",
          "val2": "0.00",
          "chgp": "",
          "chgp_class": "neutral"
        },
        {
          "field": "Standalone Net Profit",
          "val1": "1.71",
          "val2": "0.42",
          "chgp": "307.14%",
          "chgp_class": "positive"
        },
        {
          "field": "Operating Profit Margin (Excl OI)",
          "val1": "18.60%",
          "val2": "11.15%",
          "chgp": "7.45%",
          "chgp_class": "positive"
        }
      ]
    }
  },
  {
    "link": "annual",
    "btn_text": "All Annual Results",
    "header": "Annual Results Snapshot (Standalone) - Mar'26",
    "rhs": [
      {
        "prefix": "Net Sales ",
        "suffix": "YoY Growth in year ended Mar 2026 is -8.65% vs -22.22% in Mar 2025",
        "dir": 1
      },
      {
        "prefix": "Standalone Net Profit ",
        "suffix": "YoY Growth in year ended Mar 2026 is 614.81% vs -96.10% in Mar 2025",
        "dir": 1
      }
    ],
    "table": {
      "header": [
        "Mar'26",
        "Mar'25",
        "Change(%)"
      ],
      "body": [
        {
          "field": "Net Sales",
          "val1": "208.56",
          "val2": "228.32",
          "chgp": "-8.65%",
          "chgp_class": "negative"
        },
        {
          "field": "Operating Profit (PBDIT) excl Other Income",
          "val1": "38.24",
          "val2": "28.46",
          "chgp": "34.36%",
          "chgp_class": "positive"
        },
        {
          "field": "Interest",
          "val1": "18.38",
          "val2": "15.18",
          "chgp": "21.08%",
          "chgp_class": "negative"
        },
        {
          "field": "Exceptional Items",
          "val1": "0.00",
          "val2": "0.00",
          "chgp": "",
          "chgp_class": "neutral"
        },
        {
          "field": "Standalone Net Profit",
          "val1": "3.86",
          "val2": "0.54",
          "chgp": "614.81%",
          "chgp_class": "positive"
        },
        {
          "field": "Operating Profit Margin (Excl OI)",
          "val1": "18.34%",
          "val2": "12.46%",
          "chgp": "5.88%",
          "chgp_class": "positive"
        }
      ]
    }
  }
]

Quarterly Results Snapshot (Standalone) - Jun'26 - QoQstock-summary

Jun'26
Mar'26
Change(%)
Net Sales
55.46
59.36
-6.57%
Operating Profit (PBDIT) excl Other Income
9.61
10.50
-8.48%
Interest
4.65
4.22
10.19%
Exceptional Items
0.00
0.00
Standalone Net Profit
1.01
2.15
-53.02%
Operating Profit Margin (Excl OI)
17.33%
17.69%
-0.36%
Values in Rs Cr.
Direction Arrows
Net Sales

QoQ Growth in quarter ended Jun 2026 is -6.57% vs 17.01% in Mar 2026

Direction Arrows
Standalone Net Profit

QoQ Growth in quarter ended Jun 2026 is -53.02% vs 241.27% in Mar 2026

Half Yearly Results Snapshot (Standalone) - Sep'25stock-summary

Sep'25
Sep'24
Change(%)
Net Sales
98.48
137.84
-28.55%
Operating Profit (PBDIT) excl Other Income
18.23
20.17
-9.62%
Interest
9.41
7.47
25.97%
Exceptional Items
0.00
0.00
Standalone Net Profit
1.08
4.52
-76.11%
Operating Profit Margin (Excl OI)
18.51%
14.63%
3.88%
Values in Rs Cr.
Direction Arrows
Net Sales

Growth in half year ended Sep 2025 is -28.55% vs 8.78% in Sep 2024

Direction Arrows
Standalone Net Profit

Growth in half year ended Sep 2025 is -76.11% vs 11.60% in Sep 2024

Nine Monthly Results Snapshot (Standalone) - Dec'25stock-summary

Dec'25
Dec'24
Change(%)
Net Sales
149.21
189.63
-21.32%
Operating Profit (PBDIT) excl Other Income
27.76
21.15
31.25%
Interest
14.16
11.30
25.31%
Exceptional Items
0.00
0.00
Standalone Net Profit
1.71
0.42
307.14%
Operating Profit Margin (Excl OI)
18.60%
11.15%
7.45%
Values in Rs Cr.
Direction Arrows
Net Sales

YoY Growth in nine months ended Dec 2025 is -21.32% vs -11.06% in Dec 2024

Direction Arrows
Standalone Net Profit

YoY Growth in nine months ended Dec 2025 is 307.14% vs -95.41% in Dec 2024

Annual Results Snapshot (Standalone) - Mar'26stock-summary

Mar'26
Mar'25
Change(%)
Net Sales
208.56
228.32
-8.65%
Operating Profit (PBDIT) excl Other Income
38.24
28.46
34.36%
Interest
18.38
15.18
21.08%
Exceptional Items
0.00
0.00
Standalone Net Profit
3.86
0.54
614.81%
Operating Profit Margin (Excl OI)
18.34%
12.46%
5.88%
Values in Rs Cr.
Direction Arrows
Net Sales

YoY Growth in year ended Mar 2026 is -8.65% vs -22.22% in Mar 2025

Direction Arrows
Standalone Net Profit

YoY Growth in year ended Mar 2026 is 614.81% vs -96.10% in Mar 2025

stock-summaryCompany CV
About Lokesh Machines Ltd stock-summary
stock-summary
Lokesh Machines Ltd
Micro Cap
Industrial Manufacturing
Established in December, 1983 and commencing operations in 1985 in Hyderabad, Lokesh Machines Limited (LML) has established itself as a specialist in manufacturing machine tools and auto components. The Company excels in producing Finish Cam & Crank Boring, Finish Barrel Boring, and Finish Joint Faces Milling machines. It serves a diverse range of industries, including automotive, agri-implements, gas turbines, aerospace, defence, medical devices and railways.
Company Coordinates stock-summary
Company Details
B-29 EEIE Stage-II, Balanagar Hyderabad Telangana : 500037
stock-summary
Tel: 91-40-23079310-23079313
stock-summary
investorinfo@lokeshmachines.com
Registrar Details
Karvy Computershare Pvt Ltd, Plot No 17-24 , Near Image Hospital,, Reliance Cybervilae,Vithalrao Nagar,, Madhapur, Hyderabad