
Compare Longspur Intl with Similar Stocks
Dashboard
With a Operating Losses, the company has a Weak Long Term Fundamental Strength
- Poor long term growth as Operating profit has grown by an annual rate 12.47% of over the last 5 years
- Company's ability to service its debt is weak with a poor EBIT to Interest (avg) ratio of 0.46
Flat results in Mar 26
With ROCE of 2, it has a Expensive valuation with a 0.6 Enterprise value to Capital Employed
Stock DNA
Non Banking Financial Company (NBFC)
INR 13 Cr (Micro Cap)
38.00
23
0.00%
0.33
1.76%
0.44
Total Returns (Price + Dividend) 
Latest dividend: 0.5 per share ex-dividend date: Sep-19-2013
Risk Adjusted Returns v/s
Returns Beta

News
When is the next results date for Longspur International Ventures Ltd?
The next results date for Longspur International Ventures Ltd is scheduled for July 6, 2026....
Read full news article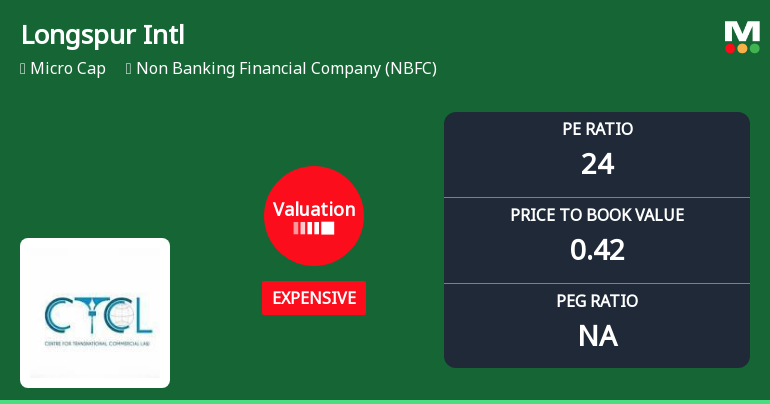
Longspur International Ventures Ltd Valuation Shifts Signal Price Attractiveness Concerns
Longspur International Ventures Ltd, a micro-cap player in the Non Banking Financial Company (NBFC) sector, has seen a notable shift in its valuation parameters, moving from fair to expensive territory. Despite a robust stock price rally outperforming the Sensex over multiple time frames, the company’s elevated price-to-earnings (P/E) ratio and subdued return metrics raise questions about its current price attractiveness relative to peers and historical benchmarks.
Read full news article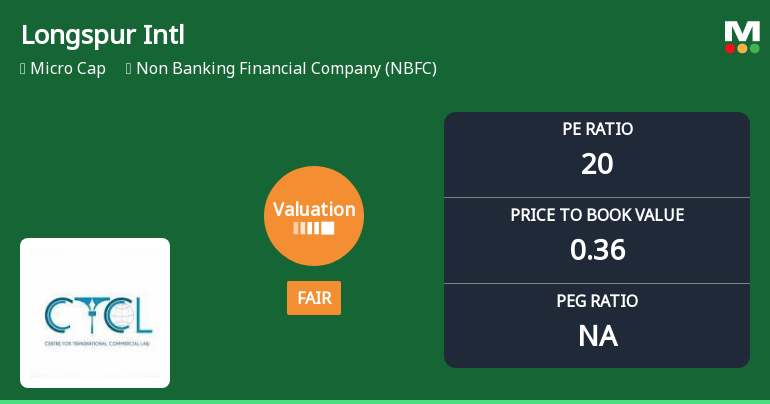
Longspur International Ventures Ltd: Valuation Shifts Signal Changing Price Attractiveness
Longspur International Ventures Ltd, a micro-cap player in the Non Banking Financial Company (NBFC) sector, has witnessed a notable shift in its valuation parameters, moving from a previously very attractive stance to a fair valuation grade. This change reflects evolving market perceptions amid mixed financial metrics and sector dynamics, prompting investors to reassess the stock’s price attractiveness relative to its peers and historical benchmarks.
Read full news article Announcements
Announcement under Regulation 30 (LODR)-Allotment
24-Jun-2026 | Source : BSEOutcome of the Board Meeting held on 24th June 2026 for allotment of 5230000 of face value of Rs.10/- each fully paid up at a price of Rs.10/- per equity share.
Board Meeting Intimation for Approval Of The Unaudited Quarterly Financial Results For The Quarter Ended 30Th June 2026
24-Jun-2026 | Source : BSELongspur International Ventures Ltdhas informed BSE that the meeting of the Board of Directors of the Company is scheduled on 06/07/2026 inter alia to consider and approve the following businesses along with routine business. 1.Approval of the Un-Audited Quarterly Financial Results of the company for the quarter ended on 30th June 2026; 2.To take on record the Limited Review Report by the auditors for the Financial Results of the company for the quarter ended on 30th June 2026; 3.Any other matter as considered by Board.
Announcement under Regulation 30 (LODR)-Allotment
24-Jun-2026 | Source : BSEOutcome of the Board meeting held on 24th June2026 for allotment of 3300000 equity shares of face Value of rs.10/- each fully paid at price of rs.10/- per equity share
Corporate Actions

06 Jul 2026

Longspur International Ventures Ltd has declared 5% dividend, ex-date: 19 Sep 13

Longspur International Ventures Ltd has announced 1:10 stock split, ex-date: 27 Dec 17

Longspur International Ventures Ltd has announced 4:1 bonus issue, ex-date: 23 Aug 11

No Rights history available
Quality key factors
Valuation key factors
Technicals key factors
 Technical Indicator Scale: Bearish, Mildly Bearish, Sideways, Mildly Bullish, Bullish Turned
 Shareholding Snapshot : Mar 2026
Shareholding Compare (%holding)
Non Institution
None
Held by 0 Schemes
Held by 0 FIIs
Manoj Naginlal Jain (22.78%)
Sajag Bardia (4.13%)
63.36%
Quarterly Results Snapshot (Standalone) - Mar'26 - YoY

YoY Growth in quarter ended Mar 2026 is -4.55% vs 275.61% in Mar 2025
YoY Growth in quarter ended Mar 2026 is -238.10% vs 158.33% in Mar 2025
Half Yearly Results Snapshot (Standalone) - Sep'25
Growth in half year ended Sep 2025 is -81.62% vs 101.12% in Sep 2024

Growth in half year ended Sep 2025 is 52.94% vs -17.07% in Sep 2024
Nine Monthly Results Snapshot (Standalone) - Dec'25
YoY Growth in nine months ended Dec 2025 is -66.20% vs 84.31% in Dec 2024
YoY Growth in nine months ended Dec 2025 is 110.26% vs -49.35% in Dec 2024
Annual Results Snapshot (Standalone) - Mar'26
YoY Growth in year ended Mar 2026 is -56.06% vs 100.85% in Mar 2025
YoY Growth in year ended Mar 2026 is -11.67% vs 33.33% in Mar 2025
About Longspur International Ventures Ltd

Company Coordinates


