
Compare Lords Chloro with Similar Stocks
Stock DNA
Commodity Chemicals
INR 414 Cr (Micro Cap)
15.00
47
0.00%
0.65
14.15%
2.07
Total Returns (Price + Dividend) 
Lords Chloro for the last several years.
Risk Adjusted Returns v/s
Returns Beta

News
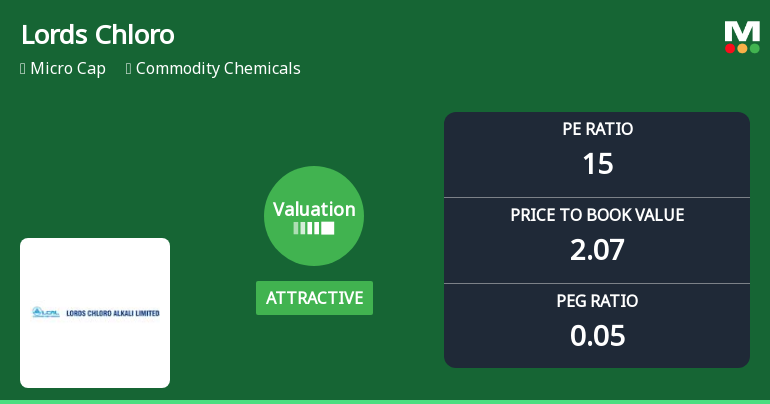
Lords Chloro Alkali Ltd Valuation Shifts Signal Renewed Price Attractiveness
Lords Chloro Alkali Ltd, a micro-cap player in the Commodity Chemicals sector, has seen its valuation parameters improve notably, shifting from very attractive to attractive. Despite a challenging year-to-date and one-year return profile relative to the Sensex, the stock’s current price-to-earnings (P/E) and price-to-book value (P/BV) ratios suggest a more compelling entry point for investors seeking value in this segment.
Read full news article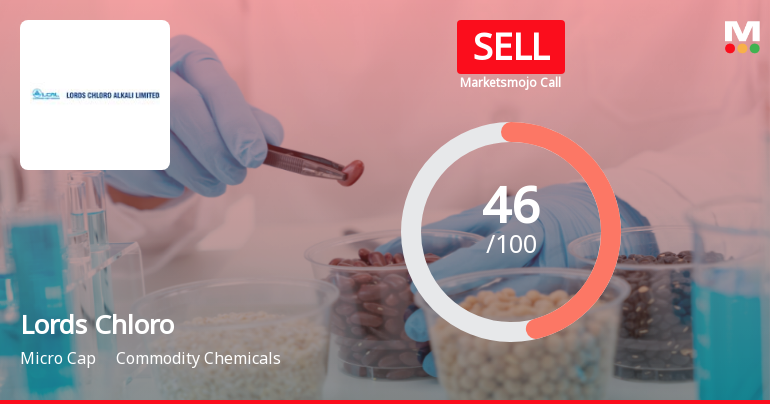
Lords Chloro Alkali Ltd Downgraded to Sell Amid Mixed Financial and Technical Signals
Lords Chloro Alkali Ltd, a micro-cap player in the commodity chemicals sector, has seen its investment rating downgraded from Hold to Sell as of 13 July 2026. This shift reflects a combination of deteriorating technical indicators, underwhelming relative returns, and mixed financial trends despite some positive operational metrics. The downgrade underscores growing concerns about the stock’s near-term momentum and valuation in a challenging market environment.
Read full news article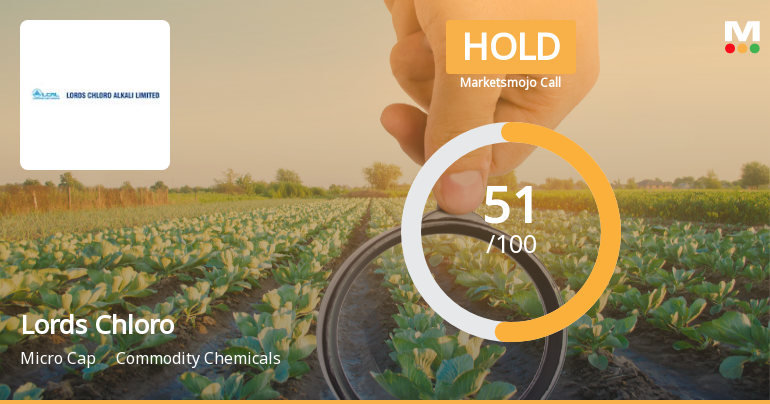
Lords Chloro Alkali Ltd Upgraded to Hold by MarketsMOJO on Technical and Financial Improvements
Lords Chloro Alkali Ltd has seen its investment rating upgraded from Sell to Hold, reflecting a notable improvement in its technical indicators and sustained financial performance. The upgrade, effective from 6 July 2026, is driven by a combination of enhanced technical trends, attractive valuation metrics, positive financial results, and a cautious but improving market sentiment.
Read full news article Announcements
Corporate Actions

No Upcoming Board Meetings

No Dividend history available

No Splits history available

No Bonus history available

No Rights history available
Quality key factors
Valuation key factors
Technicals key factors
 Technical Indicator Scale: Bearish, Mildly Bearish, Sideways, Mildly Bullish, Bullish Turned
 Shareholding Snapshot : Jun 2026
Shareholding Compare (%holding)
Promoters
None
Held by 5 Schemes (0.0%)
Held by 2 FIIs (0.01%)
Madhav Dhir (33.48%)
Mehak Infracon Private Limited (2.22%)
13.52%
Quarterly Results Snapshot (Standalone) - Mar'26 - YoY

YoY Growth in quarter ended Mar 2026 is 22.39% vs 27.71% in Mar 2025
YoY Growth in quarter ended Mar 2026 is 68.85% vs 5,300.00% in Mar 2025
Half Yearly Results Snapshot (Standalone) - Sep'25

Growth in half year ended Sep 2025 is 58.00% vs 25.05% in Sep 2024
Growth in half year ended Sep 2025 is 743.72% vs 250.00% in Sep 2024
Nine Monthly Results Snapshot (Standalone) - Dec'25
YoY Growth in nine months ended Dec 2025 is 53.59% vs 20.04% in Dec 2024
YoY Growth in nine months ended Dec 2025 is 573.18% vs 175.53% in Dec 2024
Annual Results Snapshot (Standalone) - Mar'26
YoY Growth in year ended Mar 2026 is 44.38% vs 22.21% in Mar 2025
YoY Growth in year ended Mar 2026 is 361.00% vs 228.75% in Mar 2025
About Lords Chloro Alkali Ltd

Company Coordinates


