
Compare Lords Ishwar with Similar Stocks
Dashboard
Weak Long Term Fundamental Strength with an average Return on Capital Employed (ROCE) of 3.23%
- Poor long term growth as Operating profit has grown by an annual rate 9.44% of over the last 5 years
- Low ability to service debt as the company has a high Debt to EBITDA ratio of 6.41 times
Flat results in Mar 26
Underperformed the market in the last 1 year
Stock DNA
Hotels & Resorts
INR 10 Cr (Micro Cap)
NA (Loss Making)
35
0.00%
0.99
-1.53%
1.78
Total Returns (Price + Dividend) 
Lords Ishwar for the last several years.
Risk Adjusted Returns v/s
Returns Beta

News
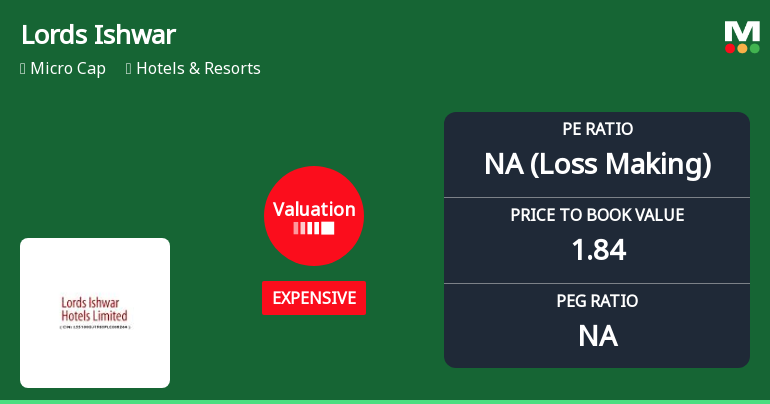
Lords Ishwar Hotels Ltd Valuation Shifts Signal Elevated Price Risk
Lords Ishwar Hotels Ltd, a micro-cap player in the Hotels & Resorts sector, has experienced a notable shift in its valuation parameters, moving from fair to expensive territory. This change, coupled with a deteriorating Mojo Grade to Strong Sell, raises concerns about the stock's price attractiveness relative to its historical averages and peer group benchmarks.
Read full news article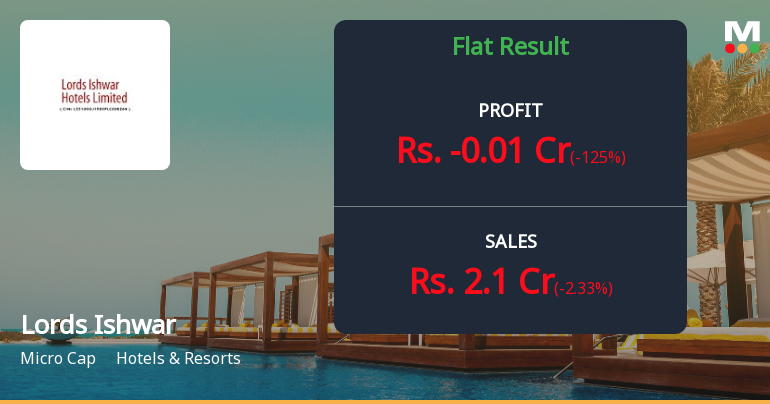
Lords Ishwar Hotels Q4 FY26: Losses Return as Margins Collapse Amid Operational Struggles
Lords Ishwar Hotels Limited, a micro-cap hospitality company operating in the Hotels & Resorts sector, slipped back into losses during the March 2026 quarter, reporting a net loss of ₹0.01 crores compared to a modest profit of ₹0.31 crores in the year-ago period. The disappointing performance comes as revenue declined 11.39% year-on-year to ₹2.10 crores, whilst operating margins collapsed from 10.97% to just 5.24%, highlighting severe operational challenges at the Gujarat-based hotel operator.
Read full news article Announcements
Announcement under Regulation 30 (LODR)-Newspaper Publication
29-May-2026 | Source : BSECopy of newspaper advertisement of Statement of Standalone Audited Financial Results for the Quarter and Year ended on 31st March 2026 published in Financial Express (English and Gujarati Edition).
Board Meeting Outcome for Outcome Of Board Meeting No. 2026-27/1
28-May-2026 | Source : BSEThe Board has considered and approved the Audited Financial Statements for the year ended 31st March 2026 and Statement of Standalone Audited Financial Results alongwith Independent Auditors Report of the Company for the quarter and year ended 31st March 2026 and also declaration with respect to Auditors Report with unmodified opinion on the said financial results is enclosed.
Audited Financial Results For The Quarter And Year Ended 31St March 2026.
28-May-2026 | Source : BSEPursuant to Regulation 33 of SEBI (LODR) Regulations 2015 statement of standalone financial results for quarter and year ended 31st March 2025 along with Independent Audit Report and un-modified opinion thereon.
Corporate Actions

No Upcoming Board Meetings

No Dividend history available

No Splits history available

No Bonus history available

No Rights history available
Quality key factors
Valuation key factors
Technicals key factors
 Technical Indicator Scale: Bearish, Mildly Bearish, Sideways, Mildly Bullish, Bullish Turned
 Shareholding Snapshot : Dec 2025
Shareholding Compare (%holding)
Promoters
None
Held by 1 Schemes (3.48%)
Held by 0 FIIs
Sssp Consultant And Techno Services Private Limited (19.85%)
Stock Holding Corporation Of India Limited (3.48%)
35.21%
Quarterly Results Snapshot (Standalone) - Mar'26 - QoQ

QoQ Growth in quarter ended Mar 2026 is -2.33% vs 49.31% in Dec 2025
QoQ Growth in quarter ended Mar 2026 is -125.00% vs 200.00% in Dec 2025
Half Yearly Results Snapshot (Standalone) - Sep'25
Growth in half year ended Sep 2025 is -15.49% vs 9.20% in Sep 2024
Growth in half year ended Sep 2025 is -300.00% vs -71.43% in Sep 2024
Nine Monthly Results Snapshot (Standalone) - Dec'25
YoY Growth in nine months ended Dec 2025 is -12.19% vs 11.13% in Dec 2024
YoY Growth in nine months ended Dec 2025 is -300.00% vs -87.10% in Dec 2024
Annual Results Snapshot (Standalone) - Mar'26
YoY Growth in year ended Mar 2026 is -11.96% vs 8.57% in Mar 2025
YoY Growth in year ended Mar 2026 is -122.86% vs -28.57% in Mar 2025
About Lords Ishwar Hotels Ltd

Company Coordinates


