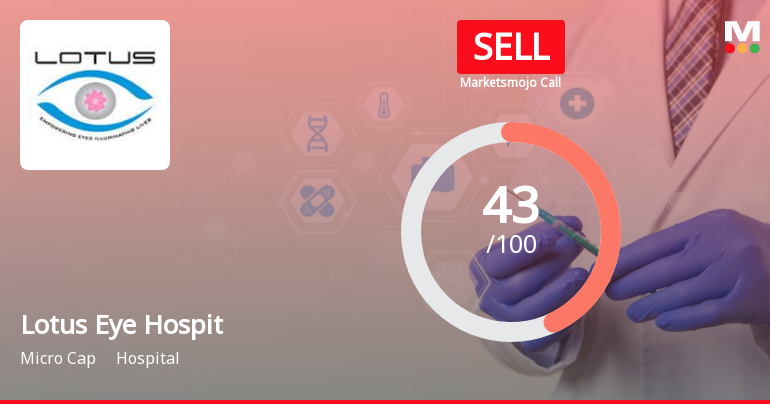
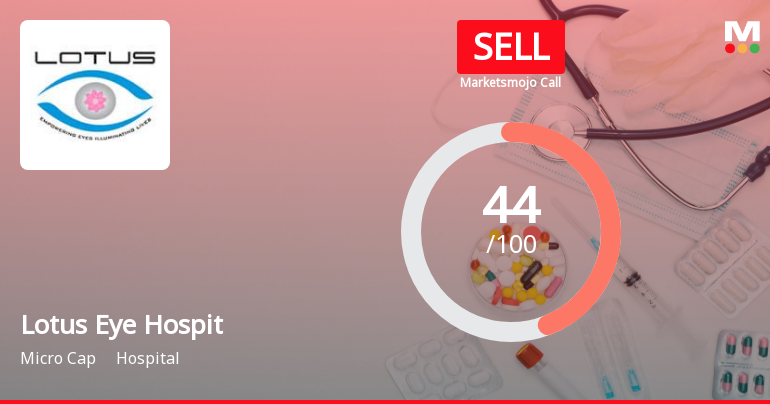
Lotus Eye Hospit

  • Market Cap: Micro Cap
  • Industry: Hospital
  • ISIN: INE947I01017
  • NSEID: LOTUSEYE
  • BSEID: 532998
INR
110.52
-2.11 (-1.87%)
BSENSE

Aug 28, 03:30 PM

BSE+NSE Vol: 34.08 k

  • Price Points
  • Score
  • Mojo Parameters
  • Total Return
  • News and Corporate Actions
  • Key factors
  • Shareholding
  • Financials
  • CompanyCV
stock-summaryPrice Point
High/Low

1Day

52 Week

Valuation
Technical
Day's Volume

CASH

34.08 k (86.34%) Volume

Shareholding (Jun 2026)

FII

0.00%

Held by 0 FIIs

DII

0.02%

Held by 0 DIIs

Promoter

40.14%

Why is Lotus Eye Hospital & Institute Ltd falling/rising?

28-Aug-2026

As of 27-Aug, the stock price of Lotus Eye Hospital & Institute Ltd is slightly rising at 112.80, but it has lost -4.08% over the last four days and is trading below all key moving averages, indicating a bearish trend and decreased investor confidence.

As of 27-Aug, the stock price of Lotus Eye Hospital & Institute Ltd is experiencing a slight rise, currently at 112.80, with a change of 0.1 (0.09%) upward. However, this minor increase comes amidst a broader context of declining performance. The stock has been underperforming, having lost -4.08% over the last four days and opened today with a loss of -2.75%. Additionally, it is trading below its 5-day, 20-day, 50-day, 100-day, and 200-day moving averages, indicating a bearish trend.<BR><BR>Investor participation has also decreased, with delivery volume falling by -21.19% compared to the 5-day average. This decline in trading activity suggests a lack of confidence among investors. Furthermore, the stock has underperformed its sector by -1% today, which adds to the negative sentiment surrounding it. Overall, while there is a slight uptick in the current price, the prevailing trends indicate that Lotus Eye Hospital & Institute Ltd is facing significant downward pressure.

View full answer

Who are in the management team of Lotus Eye Hospit?

14-Aug-2026

The management team of Lotus Eye Hospital includes S K Sundaramoorthy (Chairman cum Managing Director), Sangeetha Sundaramoorthy (Whole Time Director), and several Non-Executive Independent Directors, along with a Company Secretary. They oversee the hospital's operations and strategic direction.

The management team of Lotus Eye Hospital includes the following individuals:<BR><BR>1. **S K Sundaramoorthy** - Chairman cum Managing Director<BR>2. **Sangeetha Sundaramoorthy** - Whole Time Director<BR>3. **Kavetha Sundaramoorthy** - Promoter & Non-Executive Director<BR>4. **S S Badrinath** - Non-Executive Independent Director<BR>5. **D R Kaarthikeyan** - Non-Executive Independent Director<BR>6. **Yogesh Shah** - Non-Executive Independent Director<BR>7. **G R Karthikeyan** - Non-Executive Independent Director<BR>8. **R Subramanian** - Non-Executive Independent Director<BR>9. **M Alagiriswamy** - Non-Executive Independent Director<BR>10. **PR Rangaswami** - Alternate Director to Kavetha Sundaramoorthy<BR>11. **Aakanksha Parmar** - Company Secretary & Compliance Officer<BR><BR>This team is responsible for overseeing the operations and strategic direction of the hospital.

View full answer

What does Lotus Eye Hospit do?

14-Aug-2026

Lotus Eye Hospital & Institute Ltd is a micro-cap trust hospital specializing in eye care, with net sales of 17 Cr and a net profit of 1 Cr as of June 2026. The company has a market cap of INR 245 Cr and operates with a P/E ratio of 1,523.00.

Overview: <BR>Lotus Eye Hospital & Institute Ltd operates as a trust hospital in the healthcare industry, categorized as a micro-cap company.<BR><BR>History: <BR>The company was originally incorporated as "Kalaivani Health Centre Pvt. Limited" in 1997, changed its name to "Lotus Eye Care Hospital Pvt. Limited" in 2006, and became a Public Limited Company in 2007. The latest quarter reported for net sales and profit is June 2026.<BR><BR>Financial Snapshot: <BR>Net Sales: 17 Cr (Quarterly Results - Jun 2026) <BR>Net Profit: 1 Cr (Quarterly Results - Jun 2026) <BR>Market Cap: INR 245 Cr (Micro Cap)<BR><BR>Key Metrics: <BR>P/E: 1,523.00 <BR>Industry P/E: 67 <BR>Dividend Yield: 0.00% <BR>Debt Equity: 0.20 <BR>Return on Equity: 0.27% <BR>Price to Book: 4.05<BR><BR>Contact Details: <BR>Address: SF No770/12 Civil Aerodrome(P), Avinashi Road Coimbatore Tamil Nadu : 641014 <BR>Tel: 91-0422 4229900 <BR>Email: lotussecdept@gmail.com <BR>Website: http://www.lotuseye.org

View full answer

Who are the peers of the Lotus Eye Hospit?

14-Aug-2026

Peers of Lotus Eye Hospit include Asarfi Hospital, Aashka Hospitals, and Nephro Care, among others. Asarfi Hospital leads in 1-year return at 87.88%, while Lotus Eye Hospit has a return of 54.47%.

Peers: The peers of Lotus Eye Hospit are Asarfi Hospital, Aashka Hospitals, Abate As Indust, Vaidya Sane, Aprameya Enginee, Chandan Healthca, Nephro Care, and KHFM Hospitality.<BR><BR>Quality Snapshot: Excellent management risk is observed at Aprameya Enginee, while Average management risk is found at Asarfi Hospital and Chandan Healthca, and the rest have Below Average management risk. Growth is Excellent at Chandan Healthca and Nephro Care, while Good growth is seen at Asarfi Hospital, Average growth at Vaidya Sane, and the rest have Below Average growth. Good capital structure is noted at Asarfi Hospital, Vaidya Sane, and Aprameya Enginee, while Average capital structure is found at Aashka Hospitals and Abate As Indust, and the rest have Below Average capital structure.<BR><BR>Return Snapshot: Asarfi Hospital has the highest 1-year return at 87.88%, while Abate As Indust has the lowest at -60.15%. Lotus Eye Hospit’s 1-year return of 54.47% is significantly higher than Abate As Indust's but lower than Asarfi Hospital's. Additionally, Abate As Indust has a negative six-month return of -35.05%.

View full answer

How big is Lotus Eye Hospit?

14-Aug-2026

As of 14th August, Lotus Eye Hospital & Institute Ltd has a market capitalization of 241.24 Cr, with recent net sales of 57.26 Cr and a net profit of 0.15 Cr. Shareholder's funds are 60.00 Cr, and total assets amount to 69.49 Cr.

As of 14th August, Lotus Eye Hospital & Institute Ltd has a market capitalization of 241.24 Cr, categorizing it as a Micro Cap company.<BR><BR>In the latest four quarters, the company reported Net Sales of 57.26 Cr and a Net Profit of 0.15 Cr.<BR><BR>The latest annual period for the balance sheet is March 2025, with Shareholder's Funds amounting to 60.00 Cr and Total Assets of 69.49 Cr.

View full answer

Should I buy, sell or hold Lotus Eye Hospital & Institute Ltd?

12-Aug-2026

Are Lotus Eye Hospital & Institute Ltd latest results good or bad?

27-May-2026

Lotus Eye Hospital & Institute Ltd's latest results are concerning, showing an 18.25% increase in revenue to ₹13.61 crores but a net loss of ₹0.32 crores, indicating significant operational challenges and declining profitability. Despite revenue growth, the company's deteriorating margins and low return on equity suggest a poor overall performance.

Lotus Eye Hospital & Institute Ltd's latest results indicate a challenging situation for the company. In the fourth quarter of FY26, they reported net sales of ₹13.61 crores, which is an 18.25% increase year-on-year and the highest quarterly revenue in their history. However, this revenue growth has not translated into profitability, as the company posted a net loss of ₹0.32 crores, a significant decline compared to a profit of ₹0.25 crores in the same quarter last year.<BR><BR>The operating margin has also deteriorated sharply, falling to just 3.53% from 10.95% in the first quarter of FY26. This decline raises concerns about the company's operational efficiency, especially in a competitive market like eye care in India. Additionally, the return on equity (ROE) stands at a mere 1.07%, which is well below industry standards, further highlighting the company's struggles to generate adequate returns on shareholder capital.<BR><BR>Overall, while the revenue growth is a positive sign, the inability to achieve profitability and the significant margin compression suggest that the results are more indicative of underlying operational issues rather than a strong performance. Therefore, the latest results can be characterized as bad, reflecting critical profitability concerns and operational challenges.

View full answer

How has been the historical performance of Lotus Eye Hospit?

13-Nov-2025

Lotus Eye Hospital has experienced revenue growth from INR 32.37 crore in March 2021 to INR 49.56 crore in March 2025, but profitability has declined, with profit after tax dropping from INR 4.08 crore to INR 0.74 crore during the same period, alongside decreasing cash flow. Total assets and liabilities have both increased, indicating financial strain despite rising sales.

Answer:<BR>The historical performance of Lotus Eye Hospital shows a mixed trend over the years, with fluctuations in revenue and profit metrics.<BR><BR>Breakdown:<BR>Lotus Eye Hospital's net sales have shown a steady increase from INR 32.37 crore in March 2021 to INR 49.56 crore in March 2025, with a notable rise from INR 38.91 crore in March 2022. Total operating income has mirrored this trend, reaching INR 49.56 crore in March 2025. However, the total expenditure has also increased significantly, from INR 28.81 crore in March 2021 to INR 46.13 crore in March 2025, impacting operating profit, which fell from INR 7.58 crore in March 2023 to INR 3.43 crore in March 2025. Consequently, profit before tax decreased from INR 5.65 crore in March 2023 to INR 1.38 crore in March 2025, with profit after tax also declining from INR 4.08 crore to INR 0.74 crore during the same period. The company's total assets rose from INR 57.26 crore in March 2020 to INR 69.49 crore in March 2025, while total liabilities increased from INR 58.46 crore to INR 69.49 crore. Cash flow from operating activities decreased from INR 5 crore in March 2024 to INR 2 crore in March 2025, contributing to a net cash outflow of INR 5 crore in March 2025, compared to a net outflow of INR 2 crore in March 2024. Overall, while revenue has grown, profitability and cash flow have faced challenges in recent years.

View full answer

Is Lotus Eye Hospit overvalued or undervalued?

09-Jun-2025

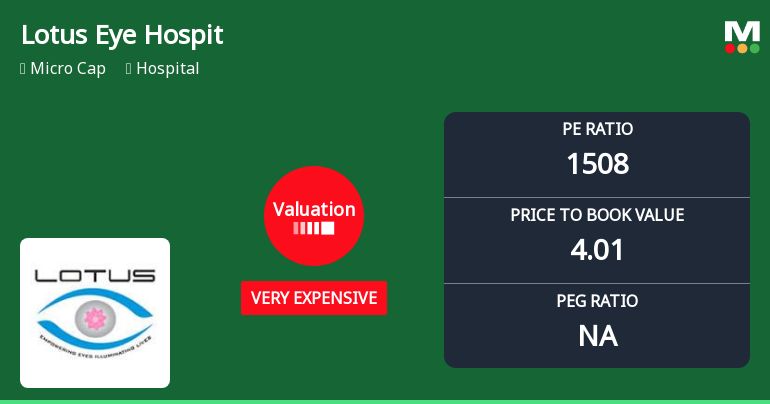
As of May 30, 2025, Lotus Eye Hospital & Institute Ltd. is considered very expensive and overvalued, with a high PE ratio of 148.28 and a low return on equity of 1.21%, indicating that its current stock price of 74.41 is not justified despite strong past stock performance.

As of 30 May 2025, the valuation grade for Lotus Eye Hospital & Institute Ltd. has moved from risky to very expensive, indicating a significant shift in its perceived value. The company is currently overvalued, as evidenced by its high PE ratio of 148.28, an EV to EBIT of 143.74, and an EV to EBITDA of 41.66, which are substantially above industry norms. <BR><BR>When compared to its peers, Lotus Eye Hospital's valuation metrics stand out unfavorably; for instance, its PE ratio is significantly higher than the industry average, suggesting that investors are paying a premium for its earnings. Additionally, the company's return on equity (ROE) is a mere 1.21%, which raises concerns about its profitability relative to its valuation. Despite a strong performance in stock returns over the past year, outpacing the Sensex, the current valuation metrics suggest that the stock is not justified at its current price of 74.41.

View full answer

What is the technical trend for Lotus Eye Hospit?

09-Jun-2025

As of June 4, 2025, Lotus Eye Hospital's technical trend is mildly bullish, supported by a bullish weekly MACD and Bollinger Bands, despite mixed signals from monthly indicators and a mildly bearish weekly Dow Theory.

As of 4 June 2025, the technical trend for Lotus Eye Hospit has changed from bullish to mildly bullish. The weekly MACD remains bullish, while the monthly MACD is mildly bearish, indicating mixed signals. The Bollinger Bands are mildly bullish on both weekly and monthly time frames, supporting a positive outlook. Daily moving averages are also mildly bullish. However, the Dow Theory shows a mildly bearish stance on the weekly chart, contrasting with a mildly bullish monthly view. Overall, the current technical stance is mildly bullish, driven primarily by the weekly MACD and Bollinger Bands, despite some bearish signals in the monthly indicators.

View full answer

Who are the top shareholders of the Lotus Eye Hospit?

06-Jun-2025

The top shareholders of Lotus Eye Hospital are Sangeetha S with 18.95%, followed by Kovai Purani Finance Private Limited at 6.67%. Individual investors hold a combined 40.95%, with no mutual funds or foreign institutional investors involved, and no pledged promoter holdings.

The top shareholders of Lotus Eye Hospital include Sangeetha S, who holds the largest stake at 18.95%. Following her, Kovai Purani Finance Private Limited is the highest public shareholder with a 6.67% ownership. Additionally, individual investors collectively hold 40.95% of the shares. There are no mutual funds or foreign institutional investors currently holding shares in the company, and there are no pledged promoter holdings.

View full answer

When is the next results date for Lotus Eye Hospit?

06-Jun-2025

No Upcoming Board Meetings

Has Lotus Eye Hospit declared dividend?

06-Jun-2025

Lotus Eye Hospital & Institute Ltd has declared a 5% dividend, amounting to 0.5 per share, with an ex-date of September 18, 2023. Despite the dividend declaration, the dividend yield is 0%, and total returns have varied across different periods, showing significant gains over the long term.

Lotus Eye Hospital & Institute Ltd has declared a 5% dividend.<BR><BR>Dividend Details:<BR>- Percentage announced: 5%<BR>- Amount per share: 0.5<BR>- Ex-date: 18 Sep 23<BR><BR>Dividend Yield: 0%<BR><BR>Total Returns by Period:<BR>In the 6-month period, the price return was -3.66%, the dividend return was 0%, resulting in a total return of -3.66%.<BR><BR>For the 1-year period, the price return was 26.61%, the dividend return was 0%, leading to a total return of 26.61%.<BR><BR>Over the 2-year period, the price return was -7.97%, the dividend return was 0.62%, resulting in a total return of -7.35%.<BR><BR>In the 3-year period, the price return was 46.37%, the dividend return was 1.99%, culminating in a total return of 48.36%.<BR><BR>For the 4-year period, the price return was 53.89%, the dividend return was 2.77%, leading to a total return of 56.66%.<BR><BR>In the 5-year period, the price return was 199.28%, the dividend return was 4.76%, resulting in a total return of 204.04%.<BR><BR>Overall, while Lotus Eye Hospital & Institute Ltd has declared a dividend, the dividend yield remains at 0%. The total returns over various periods show a mixed performance, with significant gains over longer periods, particularly in the 5-year span.

View full answer
iScoreScore
Click here to find our call on this stock
Strong Sell
Sell
Hold
Buy
Strong Buy

Dashboard

1

Weak Long Term Fundamental Strength with a -29.54% CAGR growth in Operating Profits over the last 5 years

  • The company has been able to generate a Return on Equity (avg) of 3.93% signifying low profitability per unit of shareholders funds
2

With ROCE of -0.5, it has a Very Expensive valuation with a 3.4 Enterprise value to Capital Employed

3

87.15% of Promoter Shares are Pledged

stock-summaryMojo Parameters

Mojo Parameters

Loading Valuation Snapshot...

Stock DNA

stock-summary
Industry

Hospital

stock-summary
Market cap

INR 233 Cr (Micro Cap)

stock-summary
P/E

1,438.00

stock-summary
Industry P/E

68

stock-summary
Dividend Yield

0.00%

stock-summary
Debt Equity

0.20

stock-summary
Return on Equity

0.27%

stock-summary
Price to Book

3.86

Revenue and Profits:
Net Sales:
17 Cr
(Quarterly Results - Jun 2026)
Net Profit:
1 Cr
stock-summaryTotal Returns
Total Returns (Price + Dividend) stock-summary
Dividend Yield (0%)
TimePeriod
Price Return
Dividend Return
Total Return
3 Months
2.05%
0%
2.05%
6 Months
0.3%
0%
0.3%
1 Year
1.19%
0%
1.19%
2 Years
45.73%
0%
45.73%
3 Years
26.24%
0.58%
26.82%
4 Years
65.95%
0.76%
66.71%
5 Years
157.32%
2.14%
159.46%

Latest dividend: 0.5 per share ex-dividend date: Sep-18-2023

Risk Adjusted Returns v/s stock-summary
Returns Beta
Icon
Beta has not been calculated since enough price history is not available
stock-summaryNews & Corporate Actions

Announcements stock-summary

Lotus Eye Hospital and Institute Limited - Reply to Clarification- Financial results

21-Nov-2019 | Source : NSE

Lotus Eye Hospital and Institute Limiteds Eye Hospital and Institute Limited for the quarter ended 30-Sep-2019 with respect to Regulation 33 of the SEBI (Listing Obligations and Disclosure Requirements) Regulations, 2015.

Lotus Eye Hospital and Institute Limited - Outcome of Board Meeting

15-Nov-2019 | Source : NSE

Lotus Eye Hospital and Institute Limited has informed the Exchange regarding Board meeting held on November 14, 2019.

Lotus Eye Hospital and Institute Limited - Shareholders meeting

26-Sep-2019 | Source : NSE

Lotus Eye Hospital and Institute Limited has informed the Exchange regarding Proceedings of Annual General Meeting held on September 24, 2019. Further, the company has submitted the Exchange a copy of Srutinizers report along with voting results.

Corporate Actions stock-summary

stock-summary
BOARD MEETING

No Upcoming Board Meetings

stock-summary
DIVIDEND

Lotus Eye Hospital & Institute Ltd has declared 5% dividend, ex-date: 18 Sep 23

stock-summary
SPLITS

No Splits history available

stock-summary
BONUS

No Bonus history available

stock-summary
RIGHTS

No Rights history available

stock-summaryKey Factors

Quality key factors stock-summary

Factor
Value
Sales Growth (5y)
11.30%
EBIT Growth (5y)
-29.54%
EBIT to Interest (avg)
2.49
Debt to EBITDA (avg)
1.48
Net Debt to Equity (avg)
0.20
Sales to Capital Employed (avg)
0.77
Tax Ratio
40.91%
Dividend Payout Ratio
0
Pledged Shares
87.15%
Institutional Holding
0.02%
ROCE (avg)
2.75%
ROE (avg)
3.93%

Valuation key factors

Factor
Value
P/E Ratio
1438
Industry P/E
68
Price to Book Value
3.83
EV to EBIT
242.11
EV to EBITDA
49.82
EV to Capital Employed
3.36
EV to Sales
4.23
PEG Ratio
NA
Dividend Yield
NA
ROCE (Latest)
-0.50%
ROE (Latest)
0.27%

Technicals key factors

Indicator
Weekly
Monthly
MACD
Mildly Bearish
Mildly Bearish
RSI
No Signal
No Signal
Bollinger Bands
Bearish
Mildly Bullish
Moving Averages
Mildly Bullish (Daily)
KST
Mildly Bearish
Mildly Bearish
Dow Theory
Mildly Bearish
Bullish
OBV
Mildly Bearish
No Trend
stock-summary Technical Indicator Scale: Bearish, Mildly Bearish, Sideways, Mildly Bullish, Bullish  Turned 
stock-summaryShareholding
Shareholding Snapshot : Jun 2026stock-summary
Shareholding Compare (%holding) stock-summary
Majority shareholders

Non Institution

Pledged Promoter Holdings

87.1473

Mutual Funds

Held by 0 Schemes

FIIs

Held by 0 FIIs

Promoter with highest holding

Sangeetha S (34.98%)

Highest Public shareholder

Kovai Purani Finance Private Limited (0%)

Individual Investors Holdings

36.43%

stock-summaryFinancial
[
  {
    "link": "quarterly",
    "btn_text": "All Quarterly Results",
    "header": "Quarterly Results Snapshot (Standalone) - Jun'26 - QoQ",
    "rhs": [
      {
        "prefix": "Net Sales ",
        "suffix": "QoQ Growth in quarter ended Jun 2026 is 25.35% vs 0.44% in Mar 2026",
        "dir": 1
      },
      {
        "prefix": "Standalone Net Profit ",
        "suffix": "QoQ Growth in quarter ended Jun 2026 is 290.62% vs -23.08% in Mar 2026",
        "dir": 1
      }
    ],
    "table": {
      "header": [
        "Jun'26",
        "Mar'26",
        "Change(%)"
      ],
      "body": [
        {
          "field": "Net Sales",
          "val1": "17.06",
          "val2": "13.61",
          "chgp": "25.35%",
          "chgp_class": "positive"
        },
        {
          "field": "Operating Profit (PBDIT) excl Other Income",
          "val1": "2.95",
          "val2": "0.48",
          "chgp": "514.58%",
          "chgp_class": "positive"
        },
        {
          "field": "Interest",
          "val1": "0.51",
          "val2": "0.33",
          "chgp": "54.55%",
          "chgp_class": "negative"
        },
        {
          "field": "Exceptional Items",
          "val1": "0.00",
          "val2": "-0.01",
          "chgp": "100.00%",
          "chgp_class": "positive"
        },
        {
          "field": "Standalone Net Profit",
          "val1": "0.61",
          "val2": "-0.32",
          "chgp": "290.62%",
          "chgp_class": "positive"
        },
        {
          "field": "Operating Profit Margin (Excl OI)",
          "val1": "17.29%",
          "val2": "3.53%",
          "chgp": "13.76%",
          "chgp_class": "positive"
        }
      ]
    }
  },
  {
    "link": "half-yearly",
    "btn_text": "All Half Yearly Results",
    "header": "Half Yearly Results Snapshot (Standalone) - Sep'25",
    "rhs": [
      {
        "prefix": "Net Sales ",
        "suffix": " Growth in half year ended Sep 2025 is 2.95% vs 1.98% in Sep 2024",
        "dir": 1
      },
      {
        "prefix": "Standalone Net Profit ",
        "suffix": " Growth in half year ended Sep 2025 is -9.59% vs -67.26% in Sep 2024",
        "dir": 1
      }
    ],
    "table": {
      "header": [
        "Sep'25",
        "Sep'24",
        "Change(%)"
      ],
      "body": [
        {
          "field": "Net Sales",
          "val1": "26.56",
          "val2": "25.80",
          "chgp": "2.95%",
          "chgp_class": "positive"
        },
        {
          "field": "Operating Profit (PBDIT) excl Other Income",
          "val1": "2.25",
          "val2": "2.80",
          "chgp": "-19.64%",
          "chgp_class": "negative"
        },
        {
          "field": "Interest",
          "val1": "0.24",
          "val2": "0.13",
          "chgp": "84.62%",
          "chgp_class": "negative"
        },
        {
          "field": "Exceptional Items",
          "val1": "0.00",
          "val2": "0.00",
          "chgp": "",
          "chgp_class": "neutral"
        },
        {
          "field": "Standalone Net Profit",
          "val1": "0.66",
          "val2": "0.73",
          "chgp": "-9.59%",
          "chgp_class": "negative"
        },
        {
          "field": "Operating Profit Margin (Excl OI)",
          "val1": "8.47%",
          "val2": "10.85%",
          "chgp": "-2.38%",
          "chgp_class": "negative"
        }
      ]
    }
  },
  {
    "link": "nine-monthly",
    "btn_text": "All Nine Monthly Results",
    "header": "Nine Monthly Results Snapshot (Standalone) - Dec'25",
    "rhs": [
      {
        "prefix": "Net Sales ",
        "suffix": "YoY Growth in nine months ended Dec 2025 is 5.41% vs 1.93% in Dec 2024",
        "dir": 1
      },
      {
        "prefix": "Standalone Net Profit ",
        "suffix": "YoY Growth in nine months ended Dec 2025 is -18.37% vs -83.04% in Dec 2024",
        "dir": 1
      }
    ],
    "table": {
      "header": [
        "Dec'25",
        "Dec'24",
        "Change(%)"
      ],
      "body": [
        {
          "field": "Net Sales",
          "val1": "40.11",
          "val2": "38.05",
          "chgp": "5.41%",
          "chgp_class": "positive"
        },
        {
          "field": "Operating Profit (PBDIT) excl Other Income",
          "val1": "2.90",
          "val2": "3.60",
          "chgp": "-19.44%",
          "chgp_class": "negative"
        },
        {
          "field": "Interest",
          "val1": "0.53",
          "val2": "0.26",
          "chgp": "103.85%",
          "chgp_class": "negative"
        },
        {
          "field": "Exceptional Items",
          "val1": "0.00",
          "val2": "0.00",
          "chgp": "",
          "chgp_class": "neutral"
        },
        {
          "field": "Standalone Net Profit",
          "val1": "0.40",
          "val2": "0.49",
          "chgp": "-18.37%",
          "chgp_class": "negative"
        },
        {
          "field": "Operating Profit Margin (Excl OI)",
          "val1": "7.23%",
          "val2": "9.46%",
          "chgp": "-2.23%",
          "chgp_class": "negative"
        }
      ]
    }
  },
  {
    "link": "annual",
    "btn_text": "All Annual Results",
    "header": "Annual Results Snapshot (Standalone) - Mar'26",
    "rhs": [
      {
        "prefix": "Net Sales ",
        "suffix": "YoY Growth in year ended Mar 2026 is 8.37% vs 2.80% in Mar 2025",
        "dir": 1
      },
      {
        "prefix": "Standalone Net Profit ",
        "suffix": "YoY Growth in year ended Mar 2026 is -89.19% vs -74.57% in Mar 2025",
        "dir": -1
      }
    ],
    "table": {
      "header": [
        "Mar'26",
        "Mar'25",
        "Change(%)"
      ],
      "body": [
        {
          "field": "Net Sales",
          "val1": "53.71",
          "val2": "49.56",
          "chgp": "8.37%",
          "chgp_class": "positive"
        },
        {
          "field": "Operating Profit (PBDIT) excl Other Income",
          "val1": "3.38",
          "val2": "3.43",
          "chgp": "-1.46%",
          "chgp_class": "negative"
        },
        {
          "field": "Interest",
          "val1": "0.86",
          "val2": "0.36",
          "chgp": "138.89%",
          "chgp_class": "negative"
        },
        {
          "field": "Exceptional Items",
          "val1": "0.00",
          "val2": "0.01",
          "chgp": "-100.00%",
          "chgp_class": "negative"
        },
        {
          "field": "Standalone Net Profit",
          "val1": "0.08",
          "val2": "0.74",
          "chgp": "-89.19%",
          "chgp_class": "negative"
        },
        {
          "field": "Operating Profit Margin (Excl OI)",
          "val1": "6.29%",
          "val2": "6.92%",
          "chgp": "-0.63%",
          "chgp_class": "negative"
        }
      ]
    }
  }
]

Quarterly Results Snapshot (Standalone) - Jun'26 - QoQstock-summary

Jun'26
Mar'26
Change(%)
Net Sales
17.06
13.61
25.35%
Operating Profit (PBDIT) excl Other Income
2.95
0.48
514.58%
Interest
0.51
0.33
54.55%
Exceptional Items
0.00
-0.01
100.00%
Standalone Net Profit
0.61
-0.32
290.62%
Operating Profit Margin (Excl OI)
17.29%
3.53%
13.76%
Values in Rs Cr.
Direction Arrows
Net Sales

QoQ Growth in quarter ended Jun 2026 is 25.35% vs 0.44% in Mar 2026

Direction Arrows
Standalone Net Profit

QoQ Growth in quarter ended Jun 2026 is 290.62% vs -23.08% in Mar 2026

Half Yearly Results Snapshot (Standalone) - Sep'25stock-summary

Sep'25
Sep'24
Change(%)
Net Sales
26.56
25.80
2.95%
Operating Profit (PBDIT) excl Other Income
2.25
2.80
-19.64%
Interest
0.24
0.13
84.62%
Exceptional Items
0.00
0.00
Standalone Net Profit
0.66
0.73
-9.59%
Operating Profit Margin (Excl OI)
8.47%
10.85%
-2.38%
Values in Rs Cr.
Direction Arrows
Net Sales

Growth in half year ended Sep 2025 is 2.95% vs 1.98% in Sep 2024

Direction Arrows
Standalone Net Profit

Growth in half year ended Sep 2025 is -9.59% vs -67.26% in Sep 2024

Nine Monthly Results Snapshot (Standalone) - Dec'25stock-summary

Dec'25
Dec'24
Change(%)
Net Sales
40.11
38.05
5.41%
Operating Profit (PBDIT) excl Other Income
2.90
3.60
-19.44%
Interest
0.53
0.26
103.85%
Exceptional Items
0.00
0.00
Standalone Net Profit
0.40
0.49
-18.37%
Operating Profit Margin (Excl OI)
7.23%
9.46%
-2.23%
Values in Rs Cr.
Direction Arrows
Net Sales

YoY Growth in nine months ended Dec 2025 is 5.41% vs 1.93% in Dec 2024

Direction Arrows
Standalone Net Profit

YoY Growth in nine months ended Dec 2025 is -18.37% vs -83.04% in Dec 2024

Annual Results Snapshot (Standalone) - Mar'26stock-summary

Mar'26
Mar'25
Change(%)
Net Sales
53.71
49.56
8.37%
Operating Profit (PBDIT) excl Other Income
3.38
3.43
-1.46%
Interest
0.86
0.36
138.89%
Exceptional Items
0.00
0.01
-100.00%
Standalone Net Profit
0.08
0.74
-89.19%
Operating Profit Margin (Excl OI)
6.29%
6.92%
-0.63%
Values in Rs Cr.
Direction Arrows
Net Sales

YoY Growth in year ended Mar 2026 is 8.37% vs 2.80% in Mar 2025

Direction Arrows
Standalone Net Profit

YoY Growth in year ended Mar 2026 is -89.19% vs -74.57% in Mar 2025

stock-summaryCompany CV
About Lotus Eye Hospital & Institute Ltd stock-summary
stock-summary
Lotus Eye Hospital & Institute Ltd
Micro Cap
Hospital
Lotus Eye Hospital & Institute Limited, a trust hospital, was originally incorporated as "Kalaivani Health Centre Pvt. Limited" on 14 March, 1997. The name of the Company was changed to "Lotus Eye Care Hospital Pvt. Limited" on 23 January, 2006 and later on, the Company was converted into a Public Limited Company on October 16, 2007 and subsequently, the name was changed to Lotus Eye Hospital & Institute Limited on April 12, 2013. Founded in 1990 by renowned ophthalmic surgeon late Dr. S.K.
Company Coordinates stock-summary
Company Details
SF No770/12 Civil Aerodrome(P), Avinashi Road Coimbatore Tamil Nadu : 641014
stock-summary
Tel: 91-0422 4229900
stock-summary
lotussecdept@gmail.com
Registrar Details
SKDC Consultants Ltd , Kanapathy Towers, 3rd Floor, Ganapathy, Coimbatore