
Compare Ludlow Jute with Similar Stocks
Dashboard
Poor Management Efficiency with a low ROCE of 3.95%
- The company has been able to generate a Return on Capital Employed (avg) of 3.95% signifying low profitability per unit of total capital (equity and debt)
Low ability to service debt as the company has a high Debt to EBITDA ratio of 5.06 times
Stock DNA
Paper, Forest & Jute Products
INR 328 Cr (Micro Cap)
21.00
9
0.00%
1.13
8.68%
1.85
Total Returns (Price + Dividend) 
Latest dividend: 1.5 per share ex-dividend date: Sep-04-2023
Risk Adjusted Returns v/s
Returns Beta

News
Ludlow Jute & Specialities Ltd Downgraded to Sell Amid Mixed Financial and Technical Signals
Ludlow Jute & Specialities Ltd has seen its investment rating downgraded from Hold to Sell as of 8 June 2026, reflecting a complex interplay of deteriorating technical indicators, modest valuation appeal, and mixed financial trends. Despite strong long-term returns and recent profit growth, concerns over management efficiency and debt servicing have weighed heavily on the outlook.
Read full news article
Ludlow Jute & Specialities Ltd Upgraded to Hold on Improved Technicals and Valuation
Ludlow Jute & Specialities Ltd has seen its investment rating upgraded from Sell to Hold as of 2 June 2026, reflecting notable improvements in its technical indicators and valuation metrics. Despite a recent dip in share price, the company’s long-term financial performance and market returns continue to impress, warranting a reassessment of its outlook within the Paper, Forest & Jute Products sector.
Read full news article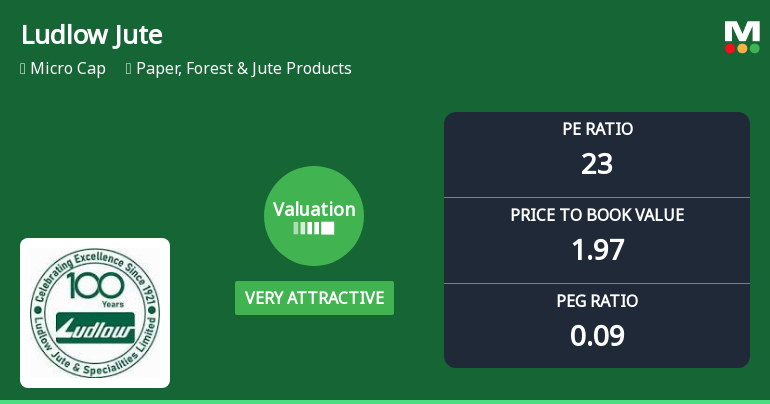
Ludlow Jute & Specialities Ltd Valuation Shifts to Very Attractive Amid Strong Returns
Ludlow Jute & Specialities Ltd has witnessed a significant shift in its valuation parameters, moving from an attractive to a very attractive rating. This change, driven by key metrics such as the price-to-earnings (P/E) and price-to-book value (P/BV) ratios, signals a renewed price attractiveness for investors amid a challenging market backdrop.
Read full news article Announcements
Compliances-Reg.24(A)-Annual Secretarial Compliance
30-May-2026 | Source : BSEIn compliance with Regulation 24A of SEBI LODR please find attached Annual Secretarial Compliance Report for the year ended 31st March 2026
Announcement under Regulation 30 (LODR)-Newspaper Publication
26-May-2026 | Source : BSEPursuant to Regulation 30 & 47 of SEBI LODR Regulation 2015 please find attached Newspaper Publications of the Audited Financial Results for the quarter ended 31st March 2026.
Constitution Of Finance Committee Of The Board
25-May-2026 | Source : BSEThe Board of Directors i their meeting held today constituted Finance Committee with effect from 25th May 2026
Corporate Actions

No Upcoming Board Meetings

Ludlow Jute & Specialities Ltd has declared 15% dividend, ex-date: 04 Sep 23

No Splits history available

No Bonus history available

No Rights history available
Quality key factors
Valuation key factors
Technicals key factors
 Technical Indicator Scale: Bearish, Mildly Bearish, Sideways, Mildly Bullish, Bullish Turned
 Shareholding Snapshot : Mar 2026
Shareholding Compare (%holding)
Promoters
None
Held by 0 Schemes
Held by 0 FIIs
Panchjanya Distributors Private Limited (67.21%)
Ratnabali Equity Private Limited (7.31%)
16.23%
Quarterly Results Snapshot (Standalone) - Mar'26 - YoY

YoY Growth in quarter ended Mar 2026 is 56.29% vs -25.67% in Mar 2025

YoY Growth in quarter ended Mar 2026 is -45.24% vs 146.41% in Mar 2025
Half Yearly Results Snapshot (Standalone) - Sep'25
Growth in half year ended Sep 2025 is 61.42% vs -38.08% in Sep 2024
Growth in half year ended Sep 2025 is 208.20% vs -128.04% in Sep 2024
Nine Monthly Results Snapshot (Standalone) - Dec'25
YoY Growth in nine months ended Dec 2025 is 86.16% vs -40.77% in Dec 2024
YoY Growth in nine months ended Dec 2025 is 212.91% vs -84.11% in Dec 2024
Annual Results Snapshot (Standalone) - Mar'26
YoY Growth in year ended Mar 2026 is 76.75% vs -36.72% in Mar 2025
YoY Growth in year ended Mar 2026 is 252.89% vs 15.71% in Mar 2025
About Ludlow Jute & Specialities Ltd

Company Coordinates


