
Compare Lument Finance Trust, Inc. with Similar Stocks
Total Returns (Price + Dividend) 
Lument Finance Trust, Inc. for the last several years.
Risk Adjusted Returns v/s
News

Lument Finance Trust Hits New 52-Week Low at $1.42
Lument Finance Trust, Inc. has reached a new 52-week low, reflecting a significant decline over the past year. The company faces financial challenges, including a notable drop in net profit and sales. Despite these struggles, it offers a high dividend yield, which may appeal to income-focused investors.
Read full news article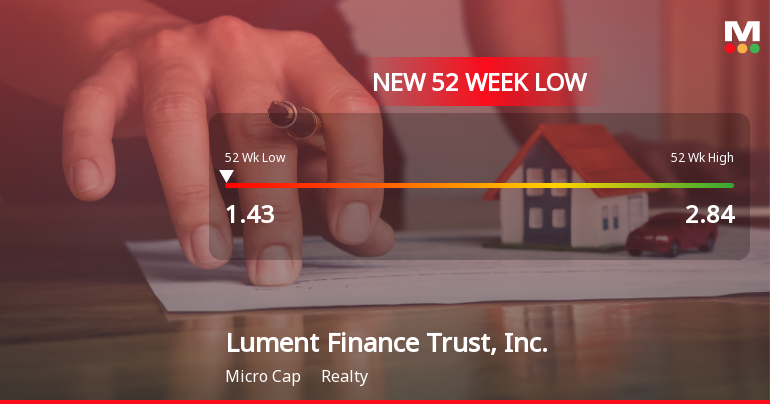
Lument Finance Trust Hits New 52-Week Low at $1.43
Lument Finance Trust, Inc. has reached a new 52-week low, experiencing a significant stock price decline over the past year. The company reports a market capitalization of USD 122 million, a P/E ratio of 9.00, and a notable drop in net profit and sales, indicating ongoing financial challenges.
Read full news article
Lument Finance Trust, Inc. Hits New 52-Week Low at $1.46
Lument Finance Trust, Inc. has reached a new 52-week low, reflecting a significant decline in its stock value over the past year. The company, with a market capitalization of USD 122 million, has reported a notable drop in net profit and sales, while maintaining a high dividend yield.
Read full news article Announcements

Corporate Actions
Quality key factors
Valuation key factors
Technicals key factors
 Technical Indicator Scale: Bearish, Mildly Bearish, Sideways, Mildly Bullish, Bullish Turned
 Shareholding Snapshot : Sep 2025
Shareholding Compare (%holding)
Domestic Funds
Held in 13 Schemes (8.63%)
Held by 23 Foreign Institutions (0.97%)
Quarterly Results Snapshot (Consolidated) - Jun'25 - YoY

YoY Growth in quarter ended Jun 2025 is -32.90% vs 35.24% in Jun 2024
YoY Growth in quarter ended Jun 2025 is -19.57% vs 76.92% in Jun 2024
Annual Results Snapshot (Consolidated) - Dec'24
YoY Growth in year ended Dec 2024 is 11.79% vs 91.93% in Dec 2023
YoY Growth in year ended Dec 2024 is 14.72% vs 98.99% in Dec 2023
About Lument Finance Trust, Inc.

Company Coordinates


