
Compare Lux Industries with Similar Stocks
Dashboard
Company has a Debt to Equity ratio (avg) of 0.10 times
Poor long term growth as Operating profit has grown by an annual rate -16.26% of over the last 5 years
The company has declared Negative results for the last 4 consecutive quarters
With ROCE of 6.8, it has a Very Attractive valuation with a 1.9 Enterprise value to Capital Employed
Despite the size of the company, domestic mutual funds hold only 0% of the company
Consistent Underperformance against the benchmark over the last 3 years
Stock DNA
Garments & Apparels
INR 3,786 Cr (Small Cap)
35.00
26
0.16%
0.20
5.88%
2.03
Total Returns (Price + Dividend) 
Latest dividend: 2 per share ex-dividend date: Sep-15-2025
Risk Adjusted Returns v/s
Returns Beta

News

Lux Industries Ltd is Rated Hold by MarketsMOJO
Lux Industries Ltd is rated 'Hold' by MarketsMOJO, with this rating last updated on 21 May 2026. However, the analysis and financial metrics discussed here reflect the stock's current position as of 23 June 2026, providing investors with an up-to-date view of the company’s fundamentals, valuation, financial trends, and technical outlook.
Read full news article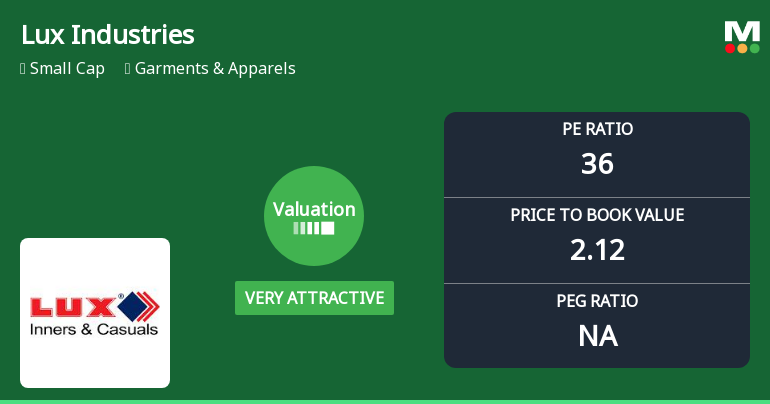
Lux Industries Ltd Valuation Shifts to Very Attractive Amid Mixed Market Returns
Lux Industries Ltd, a key player in the Garments & Apparels sector, has seen a notable improvement in its valuation parameters, shifting from an 'attractive' to a 'very attractive' rating. This change reflects a significant reappraisal of its price-to-earnings (P/E) and price-to-book value (P/BV) multiples relative to historical averages and peer benchmarks, offering investors a fresh perspective on its price attractiveness amid mixed market returns.
Read full news article
Lux Industries Ltd is Rated Hold
Lux Industries Ltd is rated 'Hold' by MarketsMOJO, with this rating last updated on 21 May 2026. However, the analysis and financial metrics discussed here reflect the stock's current position as of 12 June 2026, providing investors with an up-to-date view of the company’s fundamentals, valuation, financial trends, and technical outlook.
Read full news article Announcements
Lux Industries Limited - Investor Presentation
09-Dec-2019 | Source : NSELux Industries Limited has informed the Exchange regarding Investor Presentation
Lux Industries Limited - Updates
15-Nov-2019 | Source : NSELux Industries Limited has informed the Exchange regarding 'Newspaper Publication of Unaudited Financial Results of the Company for the quarter and half year ended 30th September, 2019.'.
Lux Industries Limited - Outcome of Board Meeting
14-Nov-2019 | Source : NSELux Industries Limited has informed the Exchange regarding Board meeting held on November 13, 2019.
Corporate Actions

No Upcoming Board Meetings

Lux Industries Ltd has declared 100% dividend, ex-date: 15 Sep 25

Lux Industries Ltd has announced 2:10 stock split, ex-date: 06 Jun 16

No Bonus history available

No Rights history available
Quality key factors
Valuation key factors
Technicals key factors
 Technical Indicator Scale: Bearish, Mildly Bearish, Sideways, Mildly Bullish, Bullish Turned
 Shareholding Snapshot : Mar 2026
Shareholding Compare (%holding)
Promoters
None
Held by 0 Schemes
Held by 37 FIIs (0.74%)
Pradip Kumar Todi (14.68%)
Life Insurance Corporation Of India (4.74%)
15.76%
Quarterly Results Snapshot (Consolidated) - Mar'26 - YoY

YoY Growth in quarter ended Mar 2026 is 6.77% vs 15.57% in Mar 2025

YoY Growth in quarter ended Mar 2026 is -8.75% vs -13.41% in Mar 2025
Half Yearly Results Snapshot (Consolidated) - Sep'25
Growth in half year ended Sep 2025 is 14.05% vs 4.56% in Sep 2024
Growth in half year ended Sep 2025 is -44.79% vs 58.38% in Sep 2024
Nine Monthly Results Snapshot (Consolidated) - Dec'25
YoY Growth in nine months ended Dec 2025 is 16.45% vs 9.56% in Dec 2024
YoY Growth in nine months ended Dec 2025 is -48.87% vs 58.45% in Dec 2024
Annual Results Snapshot (Consolidated) - Mar'26
YoY Growth in year ended Mar 2026 is 13.38% vs 11.13% in Mar 2025
YoY Growth in year ended Mar 2026 is -37.21% vs 27.63% in Mar 2025
About Lux Industries Ltd

Company Coordinates


