
Compare LWS Knitwear with Similar Stocks
Stock DNA
Trading & Distributors
INR 24 Cr (Micro Cap)
10.00
26
0.00%
0.46
7.30%
0.73
Total Returns (Price + Dividend) 
LWS Knitwear for the last several years.
Risk Adjusted Returns v/s
Returns Beta

News
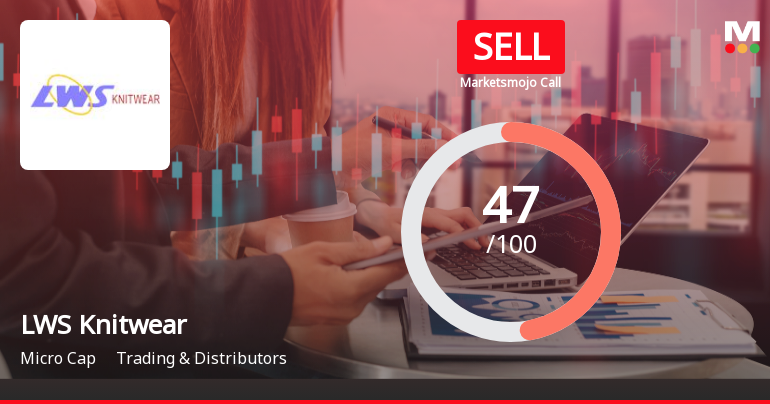
LWS Knitwear Ltd Downgraded to Sell Amidst Weak Fundamentals and Mixed Technical Signals
LWS Knitwear Ltd, a micro-cap player in the Trading & Distributors sector, has seen its investment rating downgraded from Hold to Sell as of 6 July 2026. This change reflects a combination of deteriorating technical indicators, flat financial performance, and weak long-term fundamentals, despite some valuation appeal. The company’s shares closed at ₹15.99 on 7 July 2026, down 7.41% from the previous close, signalling investor caution amid mixed signals.
Read full news article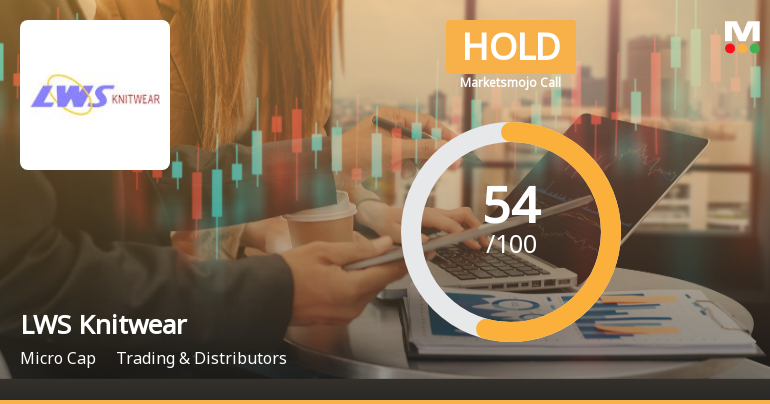
LWS Knitwear Ltd Upgraded to Hold by MarketsMOJO on Technical Improvements
LWS Knitwear Ltd, a micro-cap player in the Trading & Distributors sector, has seen its investment rating upgraded from Sell to Hold as of 30 June 2026. This change reflects a nuanced improvement across technical indicators and valuation metrics, despite ongoing challenges in financial trends and long-term fundamentals.
Read full news article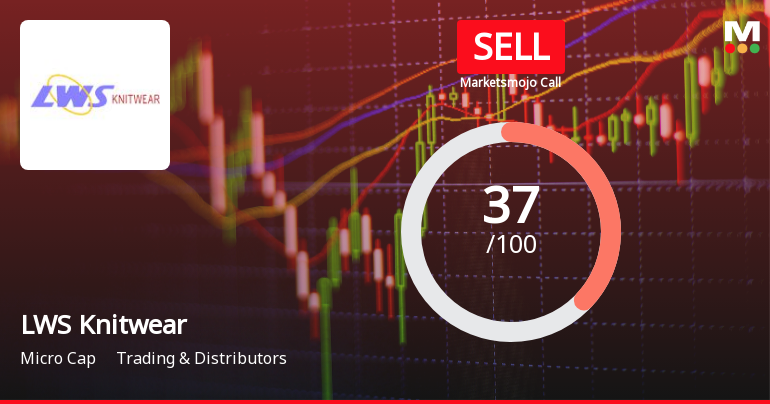
LWS Knitwear Ltd Upgraded to Sell on Technical Improvements Despite Flat Financials
LWS Knitwear Ltd has seen its investment rating upgraded from Strong Sell to Sell as of 15 June 2026, driven primarily by a shift in technical indicators despite ongoing fundamental challenges. The micro-cap textile company’s Mojo Score improved to 37.0, reflecting a nuanced market view that balances recent sideways technical trends against persistent financial underperformance.
Read full news article Announcements
Compliances-Certificate under Reg. 74 (5) of SEBI (DP) Regulations 2018
15-Jul-2026 | Source : BSECertificate for 30.06.2026 is attached herewith
Closure of Trading Window
30-Jun-2026 | Source : BSEIntimation of closure of trading window
Announcement under Regulation 30 (LODR)-Newspaper Publication
01-Jun-2026 | Source : BSENewspaper publication for Financial Results
Corporate Actions

No Upcoming Board Meetings

No Dividend history available

No Splits history available

No Bonus history available

LWS Knitwear Ltd has announced 19:10 rights issue, ex-date: 28 Nov 24
Quality key factors
Valuation key factors
Technicals key factors
 Technical Indicator Scale: Bearish, Mildly Bearish, Sideways, Mildly Bullish, Bullish Turned
 Shareholding Snapshot : Mar 2026
Shareholding Compare (%holding)
Promoters
None
Held by 0 Schemes
Held by 0 FIIs
Kusum Kapoor (26.23%)
Kailashben Ashokkumar Patel (2.79%)
39.27%
Quarterly Results Snapshot (Standalone) - Mar'26 - QoQ

QoQ Growth in quarter ended Mar 2026 is 84.22% vs -46.25% in Dec 2025

QoQ Growth in quarter ended Mar 2026 is 12.94% vs 183.33% in Dec 2025
Half Yearly Results Snapshot (Standalone) - Sep'25
Growth in half year ended Sep 2025 is 6.93% vs 83.91% in Sep 2024
Growth in half year ended Sep 2025 is 7.55% vs 341.67% in Sep 2024
Nine Monthly Results Snapshot (Standalone) - Dec'25
YoY Growth in nine months ended Dec 2025 is 7.21% vs 46.03% in Dec 2024
YoY Growth in nine months ended Dec 2025 is 1.43% vs 677.78% in Dec 2024
Annual Results Snapshot (Standalone) - Mar'26
YoY Growth in year ended Mar 2026 is -11.48% vs 44.67% in Mar 2025
YoY Growth in year ended Mar 2026 is -5.93% vs 80.71% in Mar 2025
About LWS Knitwear Ltd

Company Coordinates


