
Compare Lyka Labs with Similar Stocks
Dashboard
With a Operating Losses, the company has a Weak Long Term Fundamental Strength
- Poor long term growth as Operating profit has grown by an annual rate -201.29% of over the last 5 years
- High Debt Company with a Debt to Equity ratio (avg) of 2.30 times
The company has declared Negative results for the last 3 consecutive quarters
Risky - Negative EBITDA
Underperformed the market in the last 1 year
Stock DNA
Pharmaceuticals & Biotechnology
INR 247 Cr (Micro Cap)
NA (Loss Making)
35
0.00%
0.51
-10.87%
2.64
Total Returns (Price + Dividend) 
Lyka Labs for the last several years.
Risk Adjusted Returns v/s
Returns Beta

News

Lyka Labs Ltd is Rated Strong Sell
Lyka Labs Ltd is rated Strong Sell by MarketsMOJO, with this rating last updated on 12 Jan 2026. However, the analysis and financial metrics presented here reflect the stock’s current position as of 23 June 2026, providing investors with the latest insights into the company’s performance and outlook.
Read full news article
Lyka Labs Ltd is Rated Strong Sell
Lyka Labs Ltd is rated Strong Sell by MarketsMOJO, with this rating last updated on 12 January 2026. However, the analysis and financial metrics discussed here reflect the stock’s current position as of 11 June 2026, providing investors with the latest insights into the company’s performance and outlook.
Read full news article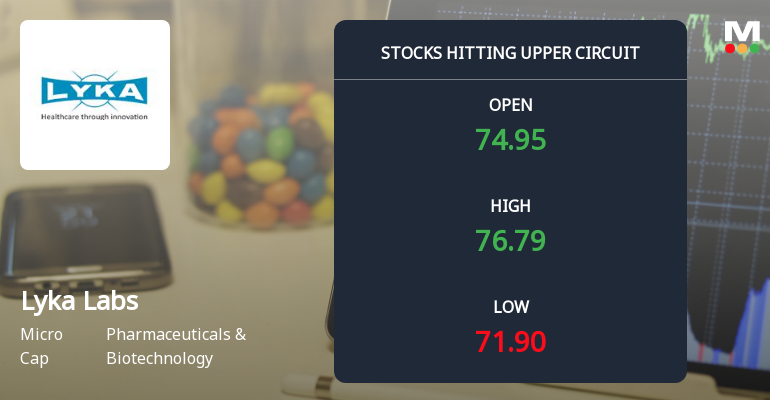
Lyka Labs Ltd Locks at Upper Circuit With 8.19% Gain — Buyers Queue, Sellers Absent
At Rs 77.05, the buying was done — not because demand dried up, but because the exchange wouldn't let the stock go any higher. Lyka Labs Ltd locked at its upper circuit of 8.19% on 10 Jun 2026, with buyers queuing and no sellers willing to part with shares.
Read full news article Announcements
Disclosure Under Regulation 30 Of SEBI (LODR) Regulations 2015 - GST
17-Jun-2026 | Source : BSEAs per the letter attached
Announcement under Regulation 30 (LODR)-Allotment
12-Jun-2026 | Source : BSEAs per the letter attached
Clarification sought from Lyka Labs Ltd
11-Jun-2026 | Source : BSEThe Exchange has sought clarification from Lyka Labs Ltd on June 11 2026 with reference to significant movement in price in order to ensure that investors have latest relevant information about the company and to inform the market so that the interest of the investors is safeguarded.
The reply is awaited.
Corporate Actions

No Upcoming Board Meetings

No Dividend history available

No Splits history available

No Bonus history available

No Rights history available
Quality key factors
Valuation key factors
Technicals key factors
 Technical Indicator Scale: Bearish, Mildly Bearish, Sideways, Mildly Bullish, Bullish Turned
 Shareholding Snapshot : Mar 2026
Shareholding Compare (%holding)
Promoters
None
Held by 4 Schemes (0.01%)
Held by 5 FIIs (0.29%)
Ipca Laboratories Limited (40.98%)
Thermo Capital Private Limited (1.99%)
31.06%
Quarterly Results Snapshot (Consolidated) - Mar'26 - YoY

YoY Growth in quarter ended Mar 2026 is -16.15% vs 20.38% in Mar 2025
YoY Growth in quarter ended Mar 2026 is -529.94% vs 184.69% in Mar 2025
Half Yearly Results Snapshot (Consolidated) - Sep'25
Growth in half year ended Sep 2025 is -2.22% vs 40.13% in Sep 2024
Growth in half year ended Sep 2025 is -168.36% vs 251.93% in Sep 2024
Nine Monthly Results Snapshot (Consolidated) - Dec'25
YoY Growth in nine months ended Dec 2025 is -4.43% vs 25.95% in Dec 2024
YoY Growth in nine months ended Dec 2025 is -138.78% vs 1,234.55% in Dec 2024
Annual Results Snapshot (Consolidated) - Mar'26
YoY Growth in year ended Mar 2026 is -7.26% vs 24.56% in Mar 2025
YoY Growth in year ended Mar 2026 is -225.22% vs 405.73% in Mar 2025
About Lyka Labs Ltd

Company Coordinates


