
Compare Lykis with Similar Stocks
Dashboard
High Debt company with Weak Long Term Fundamental Strength
- High Debt Company with a Debt to Equity ratio (avg) of 3.98 times
- The company has been able to generate a Return on Capital Employed (avg) of 7.15% signifying low profitability per unit of total capital (equity and debt)
With a growth in Net Sales of 60.47%, the company declared Very Positive results in Mar 26
With ROCE of 6, it has a Very Attractive valuation with a 1.3 Enterprise value to Capital Employed
Rising Promoter Confidence
Stock DNA
Trading & Distributors
INR 86 Cr (Micro Cap)
13.00
59
0.00%
2.43
15.86%
2.10
Total Returns (Price + Dividend) 
Lykis for the last several years.
Risk Adjusted Returns v/s
Returns Beta

News

Lykis Ltd is Rated Hold by MarketsMOJO
Lykis Ltd is rated 'Hold' by MarketsMOJO, with this rating last updated on 22 April 2026. However, the analysis and financial metrics discussed here reflect the company’s current position as of 16 June 2026, providing investors with the most recent insights into its performance and outlook.
Read full news article
Lykis Ltd is Rated Hold by MarketsMOJO
Lykis Ltd is rated 'Hold' by MarketsMOJO, with this rating last updated on 22 April 2026. However, the analysis and financial metrics discussed here reflect the company’s current position as of 04 June 2026, providing investors with an up-to-date view of the stock’s fundamentals, valuation, financial trends, and technical outlook.
Read full news article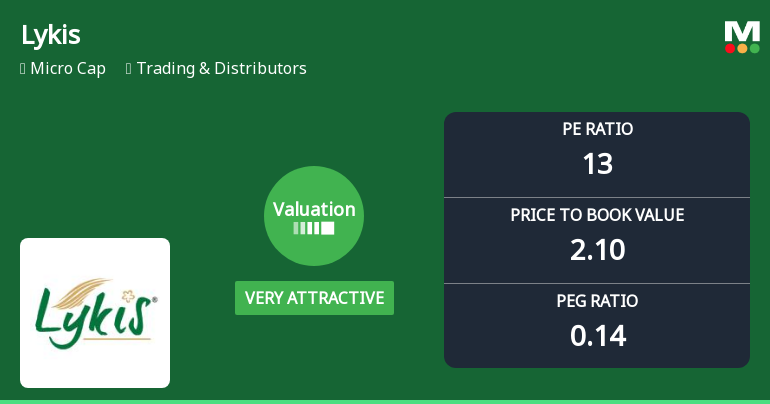
Lykis Ltd Valuation Shift Signals Renewed Price Attractiveness Amid Mixed Returns
Lykis Ltd, a micro-cap player in the Trading & Distributors sector, has witnessed a significant improvement in its valuation parameters, shifting from an attractive to a very attractive rating. This change comes amid a backdrop of mixed market returns and evolving investor sentiment, positioning Lykis as a noteworthy contender for investors seeking value in a volatile environment.
Read full news article Announcements
Announcement under Regulation 30 (LODR)-Newspaper Publication
18-Jun-2026 | Source : BSEPlease find attached the newspaper cuttings of the advertisement in relation to intimating about the 42nd Annual General Meeting.
Board Meeting Outcome for Held Today I.E. June 15 2026
15-Jun-2026 | Source : BSEOutcome of the Board Meeting held today i.e. June 15 2026
Announcement under Regulation 30 (LODR)-Change in Directorate
15-Jun-2026 | Source : BSEAppointment of Mr. Jitendra Kumar Ranka as the Chairman & Managing Director of the Company with effect from May 25 2026 subject to the approval of the Members at the ensuing AGM.
Corporate Actions

No Upcoming Board Meetings

No Dividend history available

No Splits history available

No Bonus history available

No Rights history available
Quality key factors
Valuation key factors
Technicals key factors
 Technical Indicator Scale: Bearish, Mildly Bearish, Sideways, Mildly Bullish, Bullish Turned
 Shareholding Snapshot : Mar 2026
Shareholding Compare (%holding)
Promoters
None
Held by 0 Schemes
Held by 0 FIIs
Nadir Umedali Dhrolia (0.0%)
Lykis Limited - Suspense Account (67.17%)
26.52%
Quarterly Results Snapshot (Consolidated) - Mar'26 - QoQ

QoQ Growth in quarter ended Mar 2026 is 60.47% vs 1.15% in Dec 2025
QoQ Growth in quarter ended Mar 2026 is -1.52% vs -34.00% in Dec 2025
Half Yearly Results Snapshot (Consolidated) - Sep'25
Growth in half year ended Sep 2025 is 0.00% vs -17.84% in Sep 2024
Growth in half year ended Sep 2025 is 45.98% vs -46.13% in Sep 2024
Nine Monthly Results Snapshot (Consolidated) - Dec'25
YoY Growth in nine months ended Dec 2025 is 4.84% vs -16.94% in Dec 2024
YoY Growth in nine months ended Dec 2025 is 37.39% vs -29.25% in Dec 2024
Annual Results Snapshot (Consolidated) - Mar'26
YoY Growth in year ended Mar 2026 is 32.07% vs -26.46% in Mar 2025
YoY Growth in year ended Mar 2026 is 147.89% vs -32.73% in Mar 2025
About Lykis Ltd

Company Coordinates


