
Compare Lypsa Gems with Similar Stocks
Dashboard
Weak Long Term Fundamental Strength with an average Return on Equity (ROE) of 0%
- Poor long term growth as Net Sales has grown by an annual rate of 11.86% and Operating profit at 11.71% over the last 5 years
- Company's ability to service its debt is weak with a poor EBIT to Interest (avg) ratio of -23.61
Risky - Negative EBITDA
Below par performance in long term as well as near term
Stock DNA
Gems, Jewellery And Watches
INR 15 Cr (Micro Cap)
NA (Loss Making)
45
0.00%
-0.03
-92.12%
0.91
Total Returns (Price + Dividend) 
Latest dividend: 0.3 per share ex-dividend date: Sep-23-2015
Risk Adjusted Returns v/s
Returns Beta

News
When is the next results date for Lypsa Gems & Jewellery Ltd?
The next results date for Lypsa Gems & Jewellery Ltd is scheduled for 27 May 2026....
Read full news article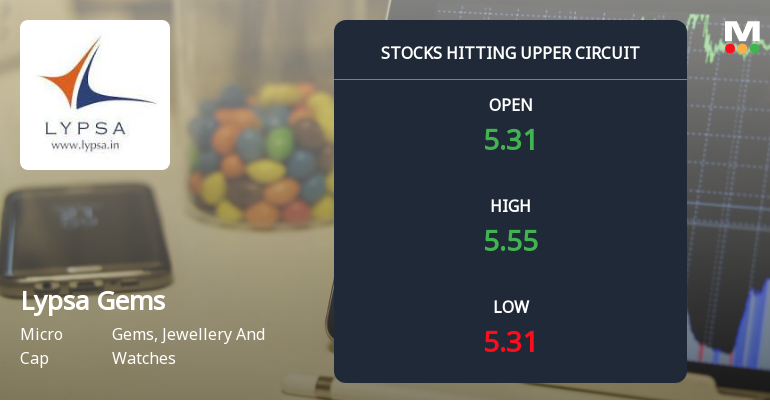
Micro-Cap Lypsa Gems & Jewellery Ltd Locks at Upper Circuit — Rs 0.02 Crore Turnover and Rising Delivery Tell the Story
At Rs 6.32, the buying was done — not because demand dried up, but because the exchange wouldn't let the stock go any higher. Lypsa Gems & Jewellery Ltd locked at its upper circuit of 20%% on 30 Apr 2026, with buyers queuing and no sellers willing to part with shares.
Read full news article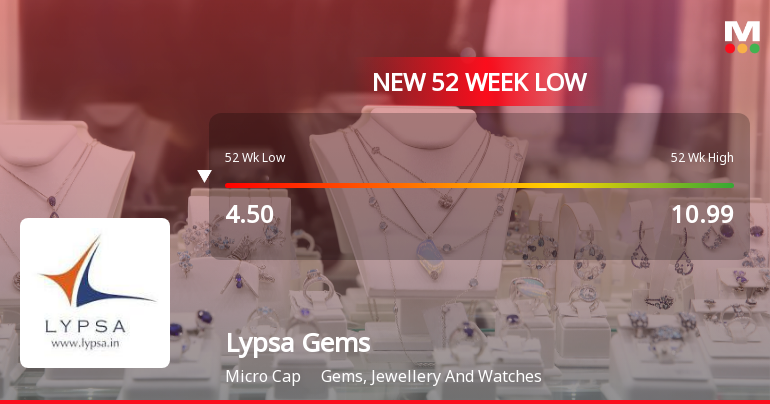
Markets Rally, But Lypsa Gems & Jewellery Ltd Sinks to 52-Week Low in Stock-Specific Sell-Off
Despite a broader market rally, Lypsa Gems & Jewellery Ltd has plunged to a fresh 52-week low of Rs 4.05 on 30 Mar 2026, marking a continuation of its downward trajectory amid persistent selling pressure.
Read full news article Announcements
Compliances-Reg.24(A)-Annual Secretarial Compliance
30-May-2026 | Source : BSEReg 24A
Announcement under Regulation 30 (LODR)-Newspaper Publication
30-May-2026 | Source : BSENewspaper Publication of Audited Financial Results for the quarter and year ended March 31 2026
Board Meeting Outcome for Audited Financial Results Along With Auditors Report For The Quarter And Year Ended March 31 2026
27-May-2026 | Source : BSEAudited Financial Results along with Auditors Report for the quarter and year ended March 31 2026
Corporate Actions

No Upcoming Board Meetings

Lypsa Gems & Jewellery Ltd has declared 3% dividend, ex-date: 23 Sep 15

No Splits history available

Lypsa Gems & Jewellery Ltd has announced 2:5 bonus issue, ex-date: 12 Jul 17

No Rights history available
Quality key factors
Valuation key factors
Technicals key factors
 Technical Indicator Scale: Bearish, Mildly Bearish, Sideways, Mildly Bullish, Bullish Turned
 Shareholding Snapshot : Mar 2026
Shareholding Compare (%holding)
Non Institution
None
Held by 0 Schemes
Held by 0 FIIs
Dipan Babulal Patwa (18.29%)
Corporate Stock Broking Pvt Ltd (2.14%)
51.92%
Quarterly Results Snapshot (Standalone) - Mar'26 - QoQ

QoQ Growth in quarter ended Mar 2026 is -61.85% vs -35.29% in Dec 2025
QoQ Growth in quarter ended Mar 2026 is -72.22% vs 1,160.00% in Dec 2025
Half Yearly Results Snapshot (Standalone) - Sep'25

Growth in half year ended Sep 2025 is 99.04% vs -30.22% in Sep 2024
Growth in half year ended Sep 2025 is 33.33% vs 350.00% in Sep 2024
Nine Monthly Results Snapshot (Standalone) - Dec'25
YoY Growth in nine months ended Dec 2025 is 28.19% vs 57.23% in Dec 2024
YoY Growth in nine months ended Dec 2025 is 1,280.00% vs 233.33% in Dec 2024
Annual Results Snapshot (Standalone) - Mar'26
YoY Growth in year ended Mar 2026 is -11.80% vs 75.87% in Mar 2025
YoY Growth in year ended Mar 2026 is 111.40% vs -50,466.67% in Mar 2025
About Lypsa Gems & Jewellery Ltd

Company Coordinates


