
Compare M & B Engineer. with Similar Stocks
Stock DNA
Construction
INR 1,714 Cr (Small Cap)
18.00
24
0.00%
-0.29
12.12%
2.59
Total Returns (Price + Dividend) 
M & B Engineer. for the last several years.
Risk Adjusted Returns v/s
Returns Beta

News

M & B Engineering Ltd is Rated Sell by MarketsMOJO
M & B Engineering Ltd is rated Sell by MarketsMOJO, with this rating last updated on 01 June 2026. However, the analysis and financial metrics discussed here reflect the company’s current position as of 29 July 2026, providing investors with the latest insights into the stock’s performance and outlook.
Read full news article
M & B Engineering Ltd is Rated Sell by MarketsMOJO
M & B Engineering Ltd is rated 'Sell' by MarketsMOJO, with this rating last updated on 01 June 2026. However, the analysis and financial metrics discussed here reflect the stock's current position as of 18 July 2026, providing investors with the latest insights into the company’s performance and outlook.
Read full news article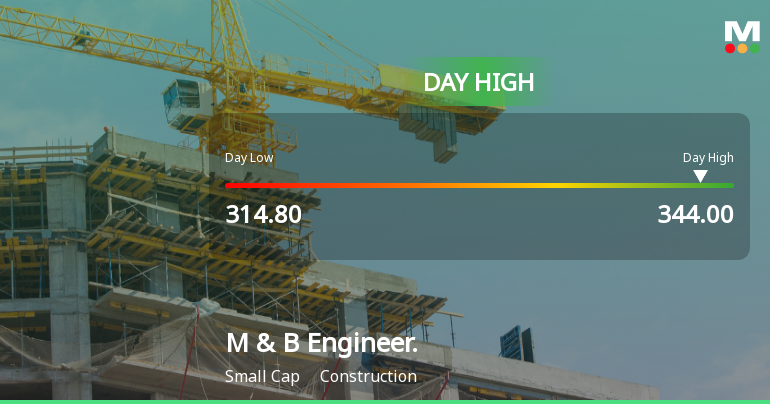
M & B Engineering Ltd Surges 7.33% to Day's High of Rs 343 — Outperforms Sector by 8.18 Percentage Points
The Sensex edged up 0.09% on 13 Jul 2026, but M & B Engineering Ltd surged 7.33%, significantly outpacing its sector by 8.18 percentage points. This sharp single-session gain rewrites the short-term narrative for the small-cap construction firm, raising the question of whether this is a genuine breakout or a technical bounce within a mixed trend.
Read full news article Announcements
Compliances-Certificate under Reg. 74 (5) of SEBI (DP) Regulations 2018
07-Jul-2026 | Source : BSEM&B Engineering Limited has informed the Stock Exchange regarding Certificate under Reg. 74(5) of SEBI (DP) Regulations 2018 for the quarter ended 30th June 2026
Closure of Trading Window
25-Jun-2026 | Source : BSEM&B Engineering Limited has informed the Stock Exchange regarding closure of Trading Window
Disclosures under Reg. 29(2) of SEBI (SAST) Regulations 2011
18-Jun-2026 | Source : BSEThe Exchange has received the disclosure under Regulation 29(2) of SEBI (Substantial Acquisition of Shares & Takeovers) Regulations 2011 for Birva Chirag Patel & Others
Corporate Actions

No Upcoming Board Meetings

No Dividend history available

No Splits history available

No Bonus history available

No Rights history available
Quality key factors
Valuation key factors
Technicals key factors
 Technical Indicator Scale: Bearish, Mildly Bearish, Sideways, Mildly Bullish, Bullish Turned
 Shareholding Snapshot : Jun 2026
Shareholding Compare (%holding)
Promoters
None
Held by 4 Schemes (5.16%)
Held by 8 FIIs (0.85%)
Girishbhai Manibhai Patel (27.16%)
Abakkus Growth Fund-2 (2.03%)
14.94%
Quarterly Results Snapshot (Standalone) - Mar'26 - QoQ

QoQ Growth in quarter ended Mar 2026 is 11.48% vs 8.36% in Dec 2025

QoQ Growth in quarter ended Mar 2026 is -25.27% vs 40.07% in Dec 2025
Half Yearly Results Snapshot (Standalone) - Sep'25
Not Applicable: The company has declared_date for only one period
Not Applicable: The company has declared_date for only one period
Nine Monthly Results Snapshot (Standalone) - Dec'25
Not Applicable: The company has declared_date for only one period
Not Applicable: The company has declared_date for only one period
Annual Results Snapshot (Standalone) - Mar'26
Not Applicable: The company has declared_date for only one period
Not Applicable: The company has declared_date for only one period
About M & B Engineering Ltd

Company Coordinates


