
Compare M K Proteins with Similar Stocks
Total Returns (Price + Dividend) 
M K Proteins for the last several years.
Risk Adjusted Returns v/s
Returns Beta

News

M K Proteins Ltd is Rated Sell by MarketsMOJO
M K Proteins Ltd is rated 'Sell' by MarketsMOJO, with this rating last updated on 30 May 2026. However, the analysis and financial metrics discussed here reflect the stock's current position as of 01 June 2026, providing investors with the most up-to-date insight into the company’s performance and outlook.
Read full news articleAre M K Proteins Ltd latest results good or bad?
M K Proteins Ltd's latest financial results for the quarter ended March 2026 reveal a complex operational landscape marked by significant challenges despite achieving record revenue. The company reported net sales of ₹145.94 crores, reflecting a sequential recovery of 62.95% from the previous quarter, yet year-on-year growth was limited to 6.37%. This modest increase suggests that while demand conditions may have improved, the company continues to struggle with market share and competitive positioning in the edible oil sector. However, the profitability metrics indicate a concerning trend. The net profit for the quarter was ₹1.14 crores, which represents a substantial decline of 59.29% both sequentially and year-on-year. This sharp drop in profitability is compounded by a significant contraction in operating margins, which fell to 1.71%, the lowest level observed since March 2025. The operating profit, exc...
Read full news article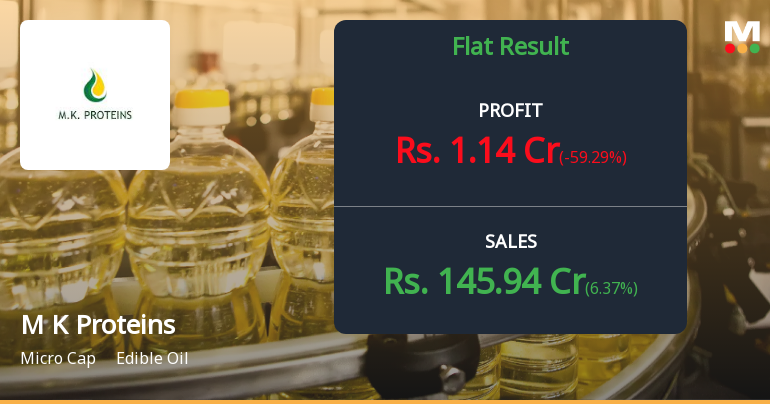
M K Proteins Q4 FY26: Margin Pressure Persists Despite Revenue Recovery
M K Proteins Ltd., a Haryana-based edible oil manufacturer, reported a challenging fourth quarter for FY26, with net profit declining 59.29% quarter-on-quarter to ₹1.14 crores despite a robust 62.95% sequential revenue recovery. The ₹191 crore market capitalisation company's profitability metrics deteriorated sharply, with PAT margin compressing to 0.78% from 1.60% in the previous quarter, raising concerns about the sustainability of its business model amidst volatile commodity markets.
Read full news article Announcements
Announcement under Regulation 30 (LODR)-Newspaper Publication
01-Jun-2026 | Source : BSEPursuant to Regulation 47 of SEBI (Listing Obligations and Disclosure Requirements) Regulations 2015 we are submitting the copies of Newspaper publications in the Financial Express (English Edition) and Jansatta (Hindi Edition) regarding the Audited Financial Results of the Company for the quarter and year ended March 31 2026
Audited Standalone Financial Results Of The Company For The Quarter And Year Ended 31St March 2026
29-May-2026 | Source : BSEWe hereby inform that the Board of Directors of the Company at its meeting held today i.e. on Friday May 29 2026 inter alia considered and approved the following matters: 1. Audited Standalone Financial Results of the Company for the Quarter and Year ended 31st March 2026 together with a Statement of Cash Flow Statement of Assets and Liabilities for the same period; 2. Auditors Report on the said Financial Results; 3. Declaration regarding unmodified opinion on Audited Standalone Financial Results under Regulation 33(3)(d) of the Securities & Exchange Board of India (Listing Obligations and Disclosure Requirements) Regulations 2016;
Board Meeting Outcome for Outcome Of The Board Meeting Held Today I.E. On 29Th May 2026
29-May-2026 | Source : BSEWe hereby inform that the Board of Directors of the Company at its meeting held today i.e. on Friday May 29 2026 inter alia considered and approved the following matters: 1. Audited Standalone Financial Results of the Company for the Quarter and Year ended 31st March 2026 together with a Statement of Cash Flow Statement of Assets and Liabilities for the same period; 2. Auditors Report on the said Financial Results 3. Declaration regarding unmodified opinion on Audited Standalone Financial Results 4. Re-appointment of M/s. K. K. Sinha & Associates as Cost Auditors of the Company for the period 2026-27 5. Re-appointment of M/s. Jayant Bansal & Co. Chartered Accountants as Internal Auditor of the Company for the Financial Year 2026-27 6. Related Party Transactions for the Half Year ended 31.03.2026 The meeting of the Board of Directors commenced at 03:30 P.M. and concluded at 04:30 P.M.
Corporate Actions

No Upcoming Board Meetings

No Dividend history available

M K Proteins Ltd has announced 1:10 stock split, ex-date: 10 Nov 23

M K Proteins Ltd has announced 2:1 bonus issue, ex-date: 15 Mar 24

No Rights history available
Quality key factors
Valuation key factors
Technicals key factors
 Technical Indicator Scale: Bearish, Mildly Bearish, Sideways, Mildly Bullish, Bullish Turned
 Shareholding Snapshot : Mar 2026
Shareholding Compare (%holding)
Promoters
None
Held by 0 Schemes
Held by 0 FIIs
Pragun Garg (6.33%)
None
21.97%
Quarterly Results Snapshot (Standalone) - Mar'26 - YoY

YoY Growth in quarter ended Mar 2026 is 6.37% vs 57.94% in Mar 2025
YoY Growth in quarter ended Mar 2026 is -59.29% vs -51.97% in Mar 2025
Half Yearly Results Snapshot (Standalone) - Sep'25

Growth in half year ended Sep 2025 is 61.92% vs 1.31% in Sep 2024
Growth in half year ended Sep 2025 is 0.71% vs 45.86% in Sep 2024
Nine Monthly Results Snapshot (Standalone) - Dec'25
YoY Growth in nine months ended Dec 2025 is 81.56% vs -17.77% in Dec 2024
YoY Growth in nine months ended Dec 2025 is 1.43% vs 4.28% in Dec 2024
Annual Results Snapshot (Standalone) - Mar'26
YoY Growth in year ended Mar 2026 is 43.02% vs 9.02% in Mar 2025
YoY Growth in year ended Mar 2026 is -18.69% vs -25.07% in Mar 2025
About M K Proteins Ltd

Company Coordinates


