
Compare M M Rubber with Similar Stocks
Dashboard
Weak Long Term Fundamental Strength with an average Return on Capital Employed (ROCE) of 5.60%
- Poor long term growth as Net Sales has grown by an annual rate of 7.49% and Operating profit at 12.22% over the last 5 years
- Company's ability to service its debt is weak with a poor EBIT to Interest (avg) ratio of 0.15
Flat results in Mar 26
Risky - Negative Operating Profits
Consistent Underperformance against the benchmark over the last 3 years
Stock DNA
Tyres & Rubber Products
INR 33 Cr (Micro Cap)
NA (Loss Making)
82
0.00%
0.77
-9.60%
2.63
Total Returns (Price + Dividend) 
M M Rubber for the last several years.
Risk Adjusted Returns v/s
Returns Beta

News
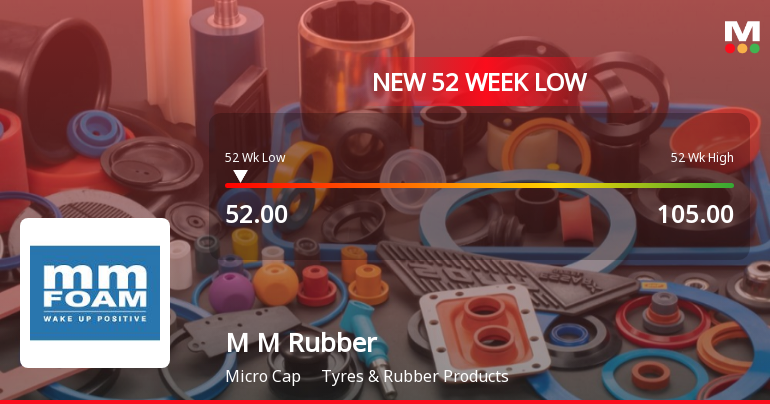
M M Rubber Co Ltd Falls to 52-Week Low of Rs 52 as Sell-Off Deepens
For the eighth consecutive session, M M Rubber Co Ltd has closed lower, culminating in a fresh 52-week low of Rs 52 on 16 Jul 2026. This marks a significant 18.56% decline over this losing streak, underscoring persistent selling pressure despite a modest market rally.
Read full news article
M M Rubber Co Ltd is Rated Strong Sell
M M Rubber Co Ltd is rated Strong Sell by MarketsMOJO, with this rating last updated on 06 January 2026. However, the analysis and financial metrics discussed here reflect the stock’s current position as of 02 July 2026, providing investors with an up-to-date view of the company’s fundamentals, valuation, financial trend, and technical outlook.
Read full news article
M M Rubber Co Ltd is Rated Strong Sell
M M Rubber Co Ltd is rated Strong Sell by MarketsMOJO, with this rating last updated on 06 January 2026. However, the analysis and financial metrics discussed here reflect the stock’s current position as of 18 June 2026, providing investors with an up-to-date view of the company’s fundamentals, valuation, financial trends, and technical outlook.
Read full news article Announcements
Compliances-Certificate under Reg. 74 (5) of SEBI (DP) Regulations 2018
10-Jul-2026 | Source : BSECertificate as per regulation 74(5) of SEBI (DP) regulations 2018 for the quarter ended 30.06.2026
Closure of Trading Window
25-Jun-2026 | Source : BSETrading Window Closure
Board Meeting Outcome for Outcome Of The Board Meeting
10-Jun-2026 | Source : BSEOutcome of the meeting
Corporate Actions

No Upcoming Board Meetings

No Dividend history available

M M Rubber Co Ltd has announced 2:10 stock split, ex-date: 15 Jul 10

No Bonus history available

No Rights history available
Quality key factors
Valuation key factors
Technicals key factors
 Technical Indicator Scale: Bearish, Mildly Bearish, Sideways, Mildly Bullish, Bullish Turned
 Shareholding Snapshot : Jun 2026
Shareholding Compare (%holding)
Non Institution
None
Held by 0 Schemes
Held by 0 FIIs
Kavita Philip (1.53%)
Naveen Bothra (5.21%)
61.78%
Quarterly Results Snapshot (Standalone) - Mar'26 - QoQ

QoQ Growth in quarter ended Mar 2026 is -5.76% vs 2.82% in Dec 2025

QoQ Growth in quarter ended Mar 2026 is 154.41% vs -65.85% in Dec 2025
Half Yearly Results Snapshot (Standalone) - Sep'25
Growth in half year ended Sep 2025 is -7.67% vs 1.25% in Sep 2024
Growth in half year ended Sep 2025 is 63.27% vs -1,389.47% in Sep 2024
Nine Monthly Results Snapshot (Standalone) - Dec'25
YoY Growth in nine months ended Dec 2025 is -4.69% vs -0.54% in Dec 2024
YoY Growth in nine months ended Dec 2025 is 58.85% vs -7,780.00% in Dec 2024
Annual Results Snapshot (Standalone) - Mar'26
YoY Growth in year ended Mar 2026 is -2.29% vs -1.54% in Mar 2025
YoY Growth in year ended Mar 2026 is 67.39% vs -123.03% in Mar 2025
About M M Rubber Co Ltd

Company Coordinates


