
Compare M M Rubber with Similar Stocks
Dashboard
Weak Long Term Fundamental Strength with an average Return on Capital Employed (ROCE) of 5.60%
- Poor long term growth as Net Sales has grown by an annual rate of 7.49% and Operating profit at 12.22% over the last 5 years
- Company's ability to service its debt is weak with a poor EBIT to Interest (avg) ratio of 0.15
Flat results in Mar 26
Risky - Negative Operating Profits
Consistent Underperformance against the benchmark over the last 3 years
Stock DNA
Tyres & Rubber Products
INR 39 Cr (Micro Cap)
NA (Loss Making)
62
0.00%
0.77
-9.60%
3.11
Total Returns (Price + Dividend) 
M M Rubber for the last several years.
Risk Adjusted Returns v/s
Returns Beta

News
Are M M Rubber Co Ltd latest results good or bad?
M M Rubber Co Ltd's latest financial results for Q4 FY26 present a complex picture of the company's operational performance. The company reported a net profit of ₹0.37 crores, marking a return to profitability after three consecutive quarters of losses. This represents a significant turnaround from a loss of ₹0.68 crores in the previous quarter. However, the revenue for the quarter stood at ₹9.98 crores, which reflects a year-on-year increase of 5.83% compared to ₹9.43 crores in Q4 FY25, yet it also indicates a sequential decline of 5.76% from ₹10.59 crores in Q3 FY26. This suggests ongoing demand volatility in the company's core segments, particularly in the sleep and upholstery markets. The operating margin for the quarter was reported at 5.31%, which shows a recovery from a negative margin of -2.64% in the previous quarter but is lower than the 6.89% margin recorded in Q4 FY25. This margin compression r...
Read full news article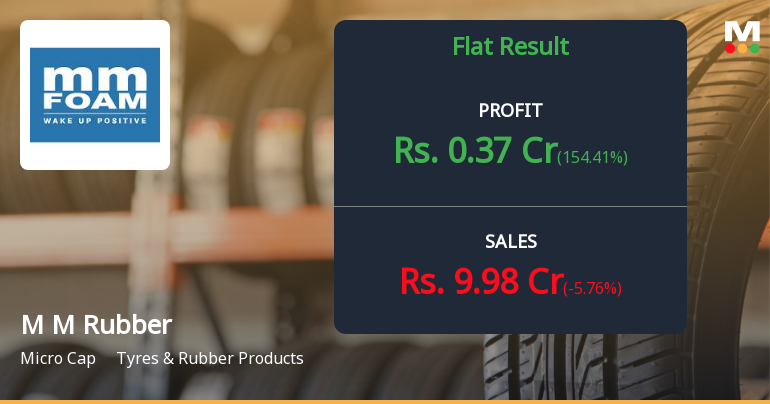
M M Rubber Co Q4 FY26: Return to Profitability Masks Deeper Structural Challenges
M M Rubber Co Ltd., a Bangalore-based manufacturer of latex foam rubber products, reported a return to quarterly profitability in Q4 FY26 with net profit of ₹0.37 crores, marking a dramatic reversal from three consecutive quarters of losses. However, the micro-cap company's stock has declined 14.53% over the past year to ₹68.38, reflecting persistent investor concerns about operational sustainability and structural profitability challenges in its core mattress and cushion manufacturing business.
Read full news article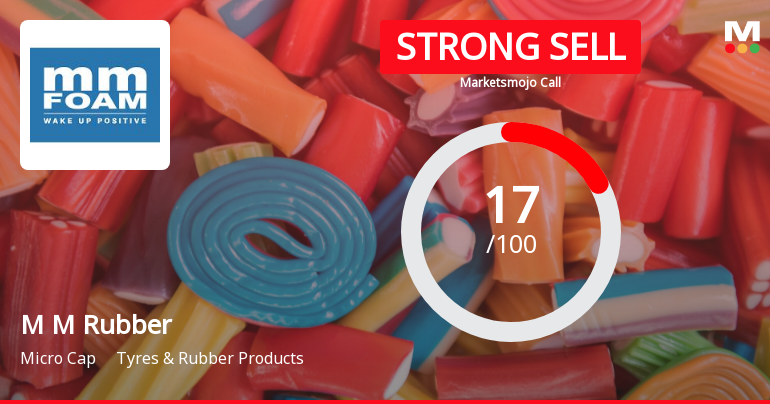
M M Rubber Co Ltd is Rated Strong Sell
M M Rubber Co Ltd is rated Strong Sell by MarketsMOJO. This rating was last updated on 06 Jan 2026, reflecting a significant reassessment of the stock’s outlook. However, all fundamentals, returns, and financial metrics discussed below are current as of 20 May 2026, providing investors with the latest comprehensive view of the company’s position.
Read full news article Announcements
Board Meeting Intimation for Intimation Of Board Meeting
02-Jun-2026 | Source : BSEMM Rubber Company Ltdhas informed BSE that the meeting of the Board of Directors of the Company is scheduled on 10/06/2026 inter alia to consider and approve Resignation of Chief Financial Officer (Key Managerial Personnel) of the Company. Appointment of Chief Financial Officer (Key Managerial Personnel) of the Company . And any other business with the permission of chair.
Announcement under Regulation 30 (LODR)-Newspaper Publication
28-May-2026 | Source : BSENewspaper advertisement of audited financial results for the year ended 31st March 2026
Financial Results For The Year Ended 31.03.2026
27-May-2026 | Source : BSEFinancial results
Corporate Actions

(10 Jun 2026)

No Dividend history available

M M Rubber Co Ltd has announced 2:10 stock split, ex-date: 15 Jul 10

No Bonus history available

No Rights history available
Quality key factors
Valuation key factors
Technicals key factors
 Technical Indicator Scale: Bearish, Mildly Bearish, Sideways, Mildly Bullish, Bullish Turned
 Shareholding Snapshot : Mar 2026
Shareholding Compare (%holding)
Non Institution
None
Held by 0 Schemes
Held by 0 FIIs
Mammen Philip (1.53%)
Naveen Bothra (5.21%)
64.95%
Quarterly Results Snapshot (Standalone) - Mar'26 - QoQ

QoQ Growth in quarter ended Mar 2026 is -5.76% vs 2.82% in Dec 2025

QoQ Growth in quarter ended Mar 2026 is 154.41% vs -65.85% in Dec 2025
Half Yearly Results Snapshot (Standalone) - Sep'25
Growth in half year ended Sep 2025 is -7.67% vs 1.25% in Sep 2024
Growth in half year ended Sep 2025 is 63.27% vs -1,389.47% in Sep 2024
Nine Monthly Results Snapshot (Standalone) - Dec'25
YoY Growth in nine months ended Dec 2025 is -4.69% vs -0.54% in Dec 2024
YoY Growth in nine months ended Dec 2025 is 58.85% vs -7,780.00% in Dec 2024
Annual Results Snapshot (Standalone) - Mar'26
YoY Growth in year ended Mar 2026 is -2.29% vs -1.54% in Mar 2025
YoY Growth in year ended Mar 2026 is 67.39% vs -123.03% in Mar 2025
About M M Rubber Co Ltd

Company Coordinates


