
Compare Mabuchi Motor Co., Ltd. with Similar Stocks
Stock DNA
Electronics & Appliances
JPY 333,827 Million (Mid Cap)
23.00
NA
0.00%
-0.41
3.74%
1.10
Total Returns (Price + Dividend) 
Mabuchi Motor Co., Ltd. for the last several years.
Risk Adjusted Returns v/s
News
Mabuchi Motor Co., Ltd. Reports Strong Financial Growth Amidst Flat Performance
Mabuchi Motor Co., Ltd. has recently released its financial results for the quarter ending June 2025, showcasing a notable increase in net profit despite an overall flat performance. The company reported a net profit of JPY 5,251.39 MM, marking an impressive growth of 75.23% compared to the previous year.
In addition to the profit growth, Mabuchi Motor Co., Ltd. has also achieved significant milestones in its financial metrics. The company’s cash and equivalents reached a record high of JPY 250,333 MM, providing a strong liquidity position. Furthermore, the dividend per share for the half-year stands at JPY 5.33, reflecting the company's commitment to returning value to its shareholders.
One of the key factors contributing to the company's performance is the decrease in raw material costs, which fell by 12.87% year-over-year. This reduction in costs has l...
Read full news article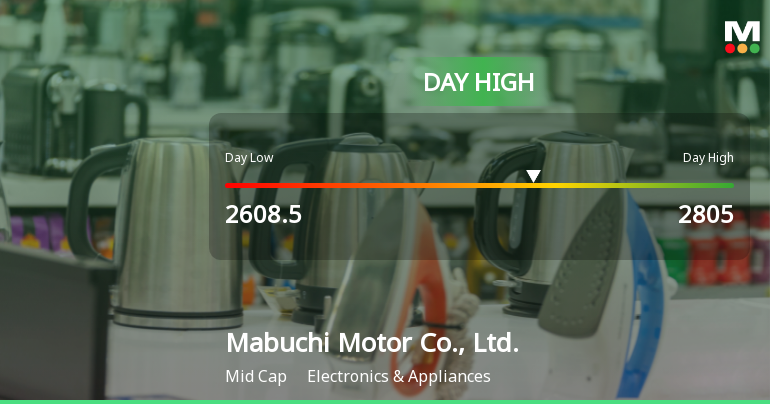
Mabuchi Motor Soars 5.15%, Hits Intraday High of JPY 2,805.00
Mabuchi Motor Co. experienced notable trading activity, rising significantly today and reaching an intraday high. While its recent performance shows some gains, longer-term trends indicate challenges. The company maintains a low debt profile and sufficient cash reserves, despite a decline in net profit for the first half of the year.
Read full news article Announcements

Corporate Actions
Quality key factors
Valuation key factors
Technicals key factors
 Technical Indicator Scale: Bearish, Mildly Bearish, Sideways, Mildly Bullish, Bullish Turned
 Shareholding Snapshot : Jun 2017
Shareholding Compare (%holding)
Foreign Institutions
Held in 0 Schemes (0%)
Held by 1 Foreign Institutions (0.0%)
Quarterly Results Snapshot (Consolidated) - Jun'25 - QoQ

QoQ Growth in quarter ended Jun 2025 is 2.11% vs -6.29% in Mar 2025

QoQ Growth in quarter ended Jun 2025 is 68.96% vs 88.17% in Mar 2025
Annual Results Snapshot (Consolidated) - Dec'24
YoY Growth in year ended Dec 2024 is 9.82% vs 14.01% in Dec 2023
YoY Growth in year ended Dec 2024 is -33.92% vs 35.82% in Dec 2023
About Mabuchi Motor Co., Ltd.

Company Coordinates


