
Compare MACOM Technology Solutions Holdings, Inc. with Similar Stocks
Dashboard
High Management Efficiency with a high ROE of 18.99%
Company has a low Debt to Equity ratio (avg) at times
Healthy long term growth as Operating profit has grown by an annual rate 57.42%
The company has declared Positive results for the last 3 consecutive quarters
Consistent Returns over the last 3 years
Stock DNA
Other Electrical Equipment
USD 16,849 Million (Small Cap)
80.00
NA
0.00%
-0.21
11.01%
12.70
Total Returns (Price + Dividend) 
MACOM Technology Solutions Holdings, Inc. for the last several years.
Risk Adjusted Returns v/s
News
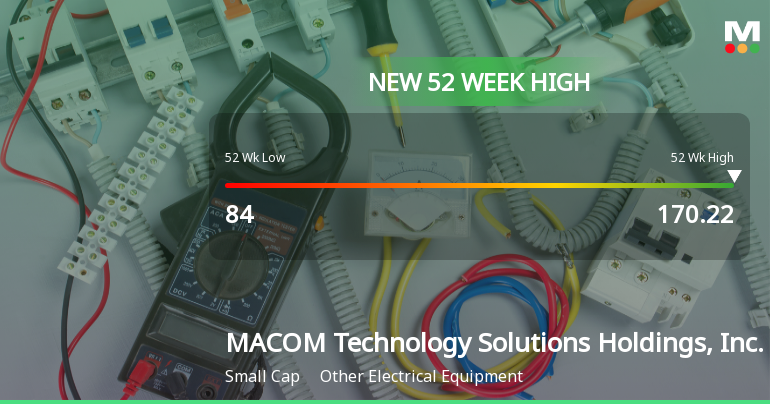
MACOM Technology Solutions Hits New 52-Week High of $170.22
MACOM Technology Solutions Holdings, Inc. achieved a new 52-week high, reflecting its strong performance in the Other Electrical Equipment industry. The company has demonstrated significant growth in operating and net profits, alongside a healthy return on equity and high institutional holdings, indicating robust financial health and investor confidence.
Read full news article Announcements

Corporate Actions
Quality key factors
Valuation key factors
Technicals key factors
 Technical Indicator Scale: Bearish, Mildly Bearish, Sideways, Mildly Bullish, Bullish Turned
 Shareholding Snapshot : Sep 2025
Shareholding Compare (%holding)
Domestic Funds
Held in 105 Schemes (54.86%)
Held by 167 Foreign Institutions (11.12%)
Quarterly Results Snapshot (Consolidated) - Sep'25 - QoQ

QoQ Growth in quarter ended Sep 2025 is 3.61% vs 6.87% in Jun 2025

QoQ Growth in quarter ended Sep 2025 is 23.56% vs 15.14% in Jun 2025
Annual Results Snapshot (Consolidated) - Sep'25
YoY Growth in year ended Sep 2025 is 32.58% vs 12.52% in Sep 2024
YoY Growth in year ended Sep 2025 is -170.48% vs -16.05% in Sep 2024
About MACOM Technology Solutions Holdings, Inc.

Company Coordinates


