Macpower CNC

  • Market Cap: Micro Cap
  • Industry: Industrial Manufacturing
  • ISIN: INE155Z01011
  • NSEID: MACPOWER
  • BSEID:
INR
1,883.60
-27.7 (-1.45%)
BSENSE

Sep 02, 03:53 PM

BSE+NSE Vol: 30923

  • Price Points
  • Score
  • Mojo Parameters
  • Total Return
  • News and Corporate Actions
  • Key factors
  • Shareholding
  • Financials
  • CompanyCV
stock-summaryPrice Point
High/Low

1Day

52 Week

Valuation
Technical
Day's Volume

CASH

30.92 k (-48.25%) Volume

Shareholding (Jun 2026)

FII

0.57%

Held by 4 FIIs

DII

0.39%

Held by 0 DIIs

Promoter

73.22%

Why is Macpower CNC Machines Ltd falling/rising?

02-Sep-2026

As of 01-Sep, Macpower CNC Machines Ltd's stock price is falling by 3.92%, but it has shown strong long-term performance with an 85.53% year-to-date increase and a 122.08% rise over the past year. Despite recent declines and reduced investor participation, the company's net-debt-free status and consistent profit growth indicate a favorable long-term outlook.

As of 01-Sep, Macpower CNC Machines Ltd's stock price is currently falling, with a change of -78.0, representing a decrease of 3.92%. Despite this recent decline, the stock has shown strong performance over various time periods, including a year-to-date increase of 85.53% and a remarkable 122.08% rise over the past year. <BR><BR>The stock's performance today has underperformed its sector by 3.98%, which may contribute to the current price drop. Additionally, there has been a notable decrease in investor participation, with delivery volume falling by 41.88% compared to the 5-day average. This decline in trading activity could indicate reduced investor confidence or interest, further impacting the stock's price negatively.<BR><BR>However, it is important to note that the company is net-debt free and has demonstrated healthy long-term growth, with operating profit increasing at an annual rate of 39.94%. Furthermore, the company has reported positive results for the last three consecutive quarters, showcasing significant growth in profit before tax, profit after tax, and net sales. <BR><BR>Overall, while Macpower CNC Machines Ltd has experienced a recent decline in stock price, its strong historical performance and positive financial indicators suggest that the long-term outlook remains favorable, despite the current short-term fluctuations.

View full answer

Who are in the management team of Macpower CNC?

01-Sep-2026

The management team of Macpower CNC includes Rupesh Mehta (Chairman & Managing Director), Riya Mehta (Director), Nikesh Mehta (Whole Time Director & CEO), and several independent directors: Maulik Mokaria, Deven Doshi, and Rajendrabhai Bhanderi, along with Kishor Kikani as Company Secretary & Compliance Officer. They are responsible for the company's strategic direction and operations.

The management team of Macpower CNC includes the following individuals:<BR><BR>1. **Rupesh Mehta** - Chairman & Managing Director<BR>2. **Riya Mehta** - Director<BR>3. **Nikesh Mehta** - Whole Time Director & CEO<BR>4. **Maulik Mokaria** - Independent Director<BR>5. **Deven Doshi** - Independent Director<BR>6. **Rajendrabhai Bhanderi** - Independent Director<BR>7. **Kishor Kikani** - Company Secretary & Compliance Officer<BR><BR>This team plays a crucial role in guiding the company's strategic direction and operations.

View full answer

What does Macpower CNC do?

01-Sep-2026

Macpower CNC Machines Ltd specializes in manufacturing CNC machines and operates in the micro-cap market. As of June 2026, it reported net sales of 95 Cr and a net profit of 10 Cr, with a market cap of INR 1,982 Cr.

Overview:<BR>Macpower CNC Machines Ltd is engaged in the industrial manufacturing sector, specifically focusing on CNC machines, and operates within the micro-cap market.<BR><BR>History:<BR>The company was originally incorporated as a private limited entity in Gujarat on December 31, 2003, under the name 'Macpower CNC Machines Private Limited.' It transitioned to a public limited company and rebranded to 'Macpower CNC Machines Limited' on November 16, 2017. The latest quarterly results reported net sales and net profit for June 2026.<BR><BR>Financial Snapshot:<BR>- Net Sales: 95 Cr (Quarterly Results - Jun 2026)<BR>- Net Profit: 10 Cr (Quarterly Results - Jun 2026)<BR>- Market Cap: INR 1,982 Cr (Micro Cap)<BR><BR>Key Metrics:<BR>- P/E: 51.00<BR>- Industry P/E: 41<BR>- Dividend Yield: 0.07%<BR>- Debt-Equity: -0.03<BR>- Return on Equity: 22.20%<BR>- Price to Book: 11.46<BR><BR>Contact Details:<BR>Address: Plot No 2234 Nr Krnati Gate, GIDC Metoda Tal Lodhika Rajkot Gujarat : 360007<BR>Tel: 91-02827-287930<BR>Email: info@macpowercnc.com<BR>Website: http://www.macpowercnc.com

View full answer

Who are the peers of the Macpower CNC?

01-Sep-2026

Peers of Macpower CNC include Pennar Industrie, Honda India, and Disa India, among others. Macpower CNC shows good growth and the highest 1-year return at 145.65%, while Honda India has the lowest return at -27.77%.

Peers: The peers of Macpower CNC are Pennar Industrie, Honda India, Kabra Extrusion, Indian Hume Pipe, Vinyas Innovativ, Disa India, Walchan. Inds., Gala Precis. Eng, and Eimco Elecon(I).<BR><BR>Quality Snapshot: Excellent management risk is observed at Honda India and Disa India, while Average management risk is found at Macpower CNC, Pennar Industrie, Kabra Extrusion, Indian Hume Pipe, Gala Precis. Eng, Vinyas Innovativ, Eimco Elecon(I), and the rest. Good growth is noted at Macpower CNC and Vinyas Innovativ, while Below Average growth is seen at Pennar Industrie, Honda India, Kabra Extrusion, Indian Hume Pipe, Disa India, Walchan. Inds., and Gala Precis. Eng. Excellent capital structure is present at Honda India, Macpower CNC, Disa India, Gala Precis. Eng, and the rest, while Below Average capital structure is noted at Pennar Industrie, Walchan. Inds., and the rest.<BR><BR>Return Snapshot: Macpower CNC has the highest 1-year return at 145.65%, while Honda India has the lowest at -27.77%. Compared to its peers, Macpower CNC's return is significantly higher. Additionally, Disa India has no available six-month return data, while the rest of the peers have positive six-month returns.

View full answer

How big is Macpower CNC?

01-Sep-2026

As of 31st August, Macpower CNC Machines Ltd has a market capitalization of 1,982.00 Cr, with recent net sales of 4,743.71 Cr and net profit of 1,666.08 Cr over the last three quarters.

As of 31st August, <BR><BR>Market Cap: Macpower CNC Machines Ltd has a market capitalization of 1,982.00 Cr and is classified as a Micro Cap.<BR><BR>Recent Quarterly Performance: The sum of Net Sales for the latest three quarters is 4,743.71 Cr, while the sum of Net Profit for the same period is 1,666.08 Cr.<BR><BR>Balance Sheet Snapshot: The reporting period is March 2025, with Shareholder's Funds amounting to 142.82 Cr and Total Assets valued at 218.06 Cr.

View full answer

Should I buy, sell or hold Macpower CNC Machines Ltd?

30-Jul-2026

Are Macpower CNC Machines Ltd latest results good or bad?

10-Feb-2026

Macpower CNC Machines Ltd's Q3 FY26 results are very good, with net sales up 42.63% to ₹86.15 crores and net profit soaring 119.02% to ₹9.79 crores, reflecting strong operational efficiency and boosting investor confidence.

Macpower CNC Machines Ltd has reported impressive results for Q3 FY26, marking a record high in several key financial metrics. The company achieved net sales of ₹86.15 crores, which represents a significant year-on-year growth of 42.63%. Additionally, the net profit reached ₹9.79 crores, reflecting a remarkable increase of 119.02% compared to the same quarter last year.<BR><BR>The operating margin also improved to 18.08%, showcasing enhanced operational efficiency. This positive performance led to a strong market reaction, with the stock price rallying 10.32% on February 10, 2026, indicating renewed investor confidence.<BR><BR>Overall, the latest results can be characterized as very good, highlighting the company's operational strength and growth potential, despite the stock still being below its 52-week high.

View full answer

Is Macpower CNC technically bullish or bearish?

03-Dec-2025

As of December 2, 2025, Macpower CNC's technical trend is neutral with mixed signals, showing mild bullishness on the weekly MACD and RSI, but bearishness on the monthly MACD and daily moving averages, indicating a lack of strong directional momentum.

As of 2 December 2025, the technical trend for Macpower CNC has changed from mildly bearish to sideways. The current technical stance is neutral, with mixed signals across different time frames. The weekly MACD is mildly bullish, while the monthly MACD is mildly bearish. The weekly RSI shows no signal, but the monthly RSI is bullish. Bollinger Bands indicate a bullish stance on the weekly chart but are mildly bearish on the monthly. Daily moving averages are mildly bearish, contrasting with the weekly and monthly KST and OBV, which are both mildly bullish. Overall, the indicators suggest a lack of strong directional momentum, leading to a neutral outlook.

View full answer

Is Macpower CNC overvalued or undervalued?

18-Nov-2025

As of November 17, 2025, Macpower CNC is considered overvalued with a valuation grade of expensive, reflected in its high PE ratio of 35.54 and a year-to-date return of -34.95%, significantly underperforming the Sensex's 10.02%.

As of 17 November 2025, Macpower CNC's valuation grade has moved from fair to expensive, indicating a shift in perception regarding its market value. The company is currently considered overvalued. Key ratios include a PE ratio of 35.54, an EV to EBITDA ratio of 22.33, and a Price to Book Value of 6.31, all of which suggest a premium valuation compared to its peers.<BR><BR>In comparison to its industry peers, Macpower CNC's PE ratio is notably higher than that of Thermax, which stands at 60.51, and BEML Ltd, with a PE of 56.55, both categorized as expensive. Additionally, while Macpower CNC has shown strong returns over the long term, its recent performance has lagged behind the Sensex, with a year-to-date return of -34.95% compared to the Sensex's 10.02%. This further reinforces the view that the stock may be overvalued in the current market environment.

View full answer

How has been the historical performance of Macpower CNC?

13-Nov-2025

Macpower CNC has faced significant financial challenges, reporting a net loss of -40,247.36 crore for the fiscal year ending March 2022, with an EPS of -49.38. Despite some growth in total assets and shareholder funds, the company has struggled with cash flow, showing a net cash outflow of -3.00 crore in March 2025.

Answer:<BR>The historical performance of Macpower CNC has shown significant challenges, particularly in the fiscal year ending March 2022, where the company reported a net sales figure of 23,449.59 crore. However, the total expenditure, excluding depreciation, was substantially higher at 52,204.87 crore, leading to an operating profit (PBDIT) of -18,135.41 crore. The profit before tax stood at -39,066.68 crore, resulting in a profit after tax of -40,247.36 crore. This negative performance is reflected in the earnings per share (EPS), which was -49.38, and a PAT margin of -171.63%. The company's financial health is further illustrated by a total debt of 0.22 crore as of March 2025, with total liabilities reaching 218.06 crore. <BR><BR>Breakdown:<BR>Macpower CNC's financial results indicate a troubling trend, particularly in March 2022, where the company faced a significant loss with a total operating income of 23,449.59 crore against an expenditure of 52,204.87 crore. This led to an operating profit of -18,135.41 crore and a profit before tax of -39,066.68 crore, culminating in a profit after tax of -40,247.36 crore. The company's earnings per share were notably negative at -49.38, highlighting its operational difficulties. Over the years, total assets have increased from 97.69 crore in March 2020 to 218.06 crore in March 2025, while shareholder's funds also grew from 66.45 crore to 142.82 crore in the same period. Despite these increases, the company has struggled with cash flow, reporting a net cash outflow of -3.00 crore in March 2025, contrasting with a cash inflow of 5.00 crore the previous year.

View full answer

Who are the top shareholders of the Macpower CNC?

17-Jul-2025

The top shareholders of Macpower CNC include promoter Rupeshkumar Jagdishchandra Mehta with 31.52%, six Foreign Institutional Investors holding 1.32%, and public shareholder Stellar Wealth Partners India Fund I Lp with 1.24%. Individual investors collectively own 20.22%, with no pledged promoter holdings or mutual funds involved.

The top shareholders of Macpower CNC include the promoters, who hold the majority of the shares. The promoter with the highest holding is Rupeshkumar Jagdishchandra Mehta, who owns 31.52% of the company. Additionally, there are six Foreign Institutional Investors (FIIs) holding a combined 1.32% of the shares. The highest public shareholder is Stellar Wealth Partners India Fund I Lp, with a holding of 1.24%. Individual investors collectively hold 20.22% of the company. Notably, there are no pledged promoter holdings and no mutual funds currently involved.

View full answer

When is the next results date for Macpower CNC?

06-Jun-2025

No Upcoming Board Meetings

What is the bonus history of the Macpower CNC?

06-Jun-2025

Macpower CNC issued a 2:100 bonus on June 30, 2020, with a record date of July 1, 2020, meaning shareholders received 2 additional shares for every 100 shares held.

Macpower CNC has a bonus history that includes a 2:100 bonus issue announced on June 30, 2020. The record date for this bonus was July 1, 2020. This means that for every 100 shares held, shareholders received an additional 2 shares as a bonus. If you have any more questions about Macpower CNC or its financial activities, feel free to ask!

View full answer

Has Macpower CNC declared dividend?

06-Jun-2025

Macpower CNC Machines Ltd has declared a 15% dividend, amounting to 1.5 per share, with an ex-date of September 20, 2024. Recent returns show volatility, with a total return of -41.62% over the last 6 months, but significant growth over longer periods, including a 1354.27% price return over the past 5 years.

Macpower CNC Machines Ltd has declared a 15% dividend.<BR><BR>Dividend Details:<BR>- Percentage announced: 15%<BR>- Amount per share: 1.5<BR>- Ex-date: Sep-20-2024<BR><BR>Dividend Yield: 0.15%.<BR><BR>Total Returns by Period:<BR>In the last 6 months, the price return was -41.62%, with a dividend return of 0%, resulting in a total return of -41.62%.<BR><BR>Over the past year, the price return was -34.78%, with a dividend return of 0.10%, leading to a total return of -34.68%.<BR><BR>In the 2-year period, the price return was 207.41%, with a dividend return of 0.92%, resulting in a total return of 208.33%.<BR><BR>For the 3-year period, the price return was 308.09%, with a dividend return of 2.05%, leading to a total return of 310.14%.<BR><BR>In the last 4 years, the price return was 735.03%, with a dividend return of 3.03%, resulting in a total return of 738.06%.<BR><BR>Over the past 5 years, the price return was 1354.27%, with a dividend return of 7.31%, leading to a total return of 1361.58%.<BR><BR>Overall, while Macpower CNC has declared a dividend, the recent total returns indicate significant volatility, particularly in the shorter time frames, with negative returns over the last 6 months and 1 year. However, the longer-term returns show substantial growth, suggesting potential recovery and profitability in the future.

View full answer
iScoreScore
Part of MojoOne Strategy
Click here to find our call on this stock
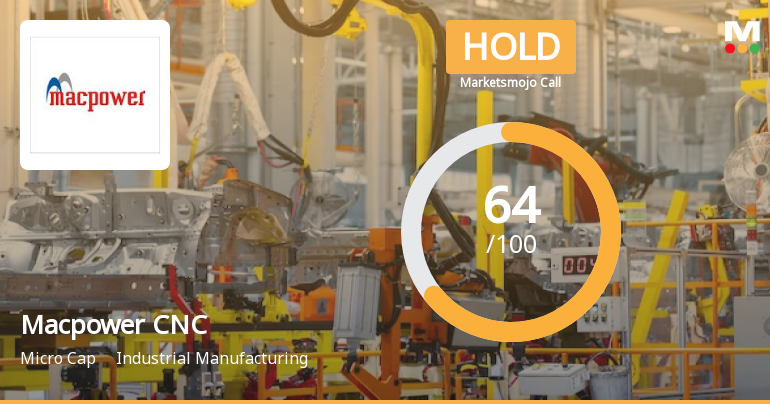
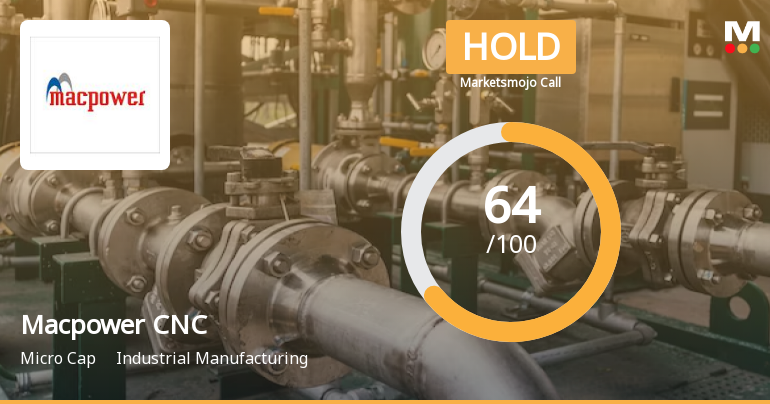
Strong Sell
Sell
Hold
Buy
Strong Buy

Dashboard

1

The company is Net-Debt Free

 
2

Healthy long term growth as Operating profit has grown by an annual rate 39.94%

 
3

The company has declared Positive results for the last 3 consecutive quarters

4

With ROE of 22.2, it has a Very Expensive valuation with a 10.9 Price to Book Value

5

Falling Participation by Institutional Investors

6

Below par performance in long term as well as near term

stock-summaryMojo Parameters

Mojo Parameters

Loading Valuation Snapshot...

Stock DNA

stock-summary
Industry

Industrial Manufacturing

stock-summary
Market cap

INR 1,892 Cr (Micro Cap)

stock-summary
P/E

49.00

stock-summary
Industry P/E

9

stock-summary
Dividend Yield

0.08%

stock-summary
Debt Equity

-0.03

stock-summary
Return on Equity

22.20%

stock-summary
Price to Book

10.91

Revenue and Profits:
Net Sales:
95 Cr
(Quarterly Results - Jun 2026)
Net Profit:
10 Cr
stock-summaryTotal Returns
Total Returns (Price + Dividend) stock-summary
Dividend Yield (0.08%)
TimePeriod
Price Return
Dividend Return
Total Return
3 Months
102.27%
0%
102.27%
6 Months
89.38%
0%
89.38%
1 Year
123.56%
0.17%
123.73%
2 Years
31.59%
0.22%
31.81%
3 Years
524.64%
1.01%
525.65%
4 Years
676.1%
1.28%
677.38%
5 Years
908.62%
3.55%
912.17%

Latest dividend: 1.5 per share ex-dividend date: Sep-10-2025

Risk Adjusted Returns v/s stock-summary
Returns Beta
Icon
Beta has not been calculated since enough price history is not available
stock-summaryNews & Corporate Actions

Announcements stock-summary

Macpower CNC Machines Limited - Investor Presentation

15-Nov-2019 | Source : NSE

Macpower CNC Machines Limited has informed the Exchange regarding Investor Presentation for financial result of half year ended on September 30, 2019.

Macpower CNC Machines Limited - Statement of deviation(s) or variation(s) under Reg. 32

25-Oct-2019 | Source : NSE

Macpower CNC Machines Limited has informed the Exchange regarding Statement of deviation(s) or variation(s) under Reg. 32 of SEBI (LODR) Regulations 2015

Corporate Actions stock-summary

stock-summary
BOARD MEETING

No Upcoming Board Meetings

stock-summary
DIVIDEND

Macpower CNC Machines Ltd has declared 15% dividend, ex-date: 10 Sep 25

stock-summary
SPLITS

No Splits history available

stock-summary
BONUS

Macpower CNC Machines Ltd has announced 2:100 bonus issue, ex-date: 30 Jun 20

stock-summary
RIGHTS

No Rights history available

stock-summaryKey Factors

Quality key factors stock-summary

Factor
Value
Sales Growth (5y)
21.17%
EBIT Growth (5y)
39.94%
EBIT to Interest (avg)
26.55
Debt to EBITDA (avg)
Net Debt is too low
Net Debt to Equity (avg)
-0.03
Sales to Capital Employed (avg)
1.95
Tax Ratio
25.38%
Dividend Payout Ratio
5.90%
Pledged Shares
0
Institutional Holding
0.96%
ROCE (avg)
23.90%
ROE (avg)
17.24%

Valuation key factors

Factor
Value
P/E Ratio
49
Industry P/E
Price to Book Value
10.91
EV to EBIT
35.55
EV to EBITDA
31.04
EV to Capital Employed
11.26
EV to Sales
5.19
PEG Ratio
1.05
Dividend Yield
0.08%
ROCE (Latest)
27.47%
ROE (Latest)
22.20%

Technicals key factors

Indicator
Weekly
Monthly
MACD
Bullish
Bullish
RSI
Bearish
No Signal
Bollinger Bands
Mildly Bullish
Mildly Bullish
Moving Averages
Bullish (Daily)
KST
Bullish
Bullish
Dow Theory
No Trend
No Trend
OBV
No Trend
No Trend
stock-summary Technical Indicator Scale: Bearish, Mildly Bearish, Sideways, Mildly Bullish, Bullish  Turned 
stock-summaryShareholding
Shareholding Snapshot : Jun 2026stock-summary
Shareholding Compare (%holding) stock-summary
Majority shareholders

Promoters

Pledged Promoter Holdings

None

Mutual Funds

Held by 0 Schemes

FIIs

Held by 4 FIIs (0.57%)

Promoter with highest holding

Rupeshkumar Jagdishchandra Mehta (31.57%)

Highest Public shareholder

None

Individual Investors Holdings

20.51%

stock-summaryFinancial
[
  {
    "link": "quarterly",
    "btn_text": "All Quarterly Results",
    "header": "Quarterly Results Snapshot (Standalone) - Jun'26 - YoY",
    "rhs": [
      {
        "prefix": "Net Sales ",
        "suffix": "YoY Growth in quarter ended Jun 2026 is 56.05% vs 21.53% in Jun 2025",
        "dir": 1
      },
      {
        "prefix": "Standalone Net Profit ",
        "suffix": "YoY Growth in quarter ended Jun 2026 is 110.09% vs 13.72% in Jun 2025",
        "dir": 1
      }
    ],
    "table": {
      "header": [
        "Jun'26",
        "Jun'25",
        "Change(%)"
      ],
      "body": [
        {
          "field": "Net Sales",
          "val1": "95.24",
          "val2": "61.03",
          "chgp": "56.05%",
          "chgp_class": "positive"
        },
        {
          "field": "Operating Profit (PBDIT) excl Other Income",
          "val1": "15.43",
          "val2": "7.92",
          "chgp": "94.82%",
          "chgp_class": "positive"
        },
        {
          "field": "Interest",
          "val1": "0.49",
          "val2": "0.10",
          "chgp": "390.00%",
          "chgp_class": "negative"
        },
        {
          "field": "Exceptional Items",
          "val1": "0.00",
          "val2": "0.00",
          "chgp": "",
          "chgp_class": "neutral"
        },
        {
          "field": "Standalone Net Profit",
          "val1": "9.58",
          "val2": "4.56",
          "chgp": "110.09%",
          "chgp_class": "positive"
        },
        {
          "field": "Operating Profit Margin (Excl OI)",
          "val1": "16.20%",
          "val2": "12.98%",
          "chgp": "3.22%",
          "chgp_class": "positive"
        }
      ]
    }
  },
  {
    "link": "half-yearly",
    "btn_text": "All Half Yearly Results",
    "header": "Half Yearly Results Snapshot (Standalone) - Sep'25",
    "rhs": [
      {
        "prefix": "Net Sales ",
        "suffix": " Growth in half year ended Sep 2025 is 20.95% vs 17.15% in Sep 2024",
        "dir": 1
      },
      {
        "prefix": "Standalone Net Profit ",
        "suffix": " Growth in half year ended Sep 2025 is 13.07% vs 50.43% in Sep 2024",
        "dir": -1
      }
    ],
    "table": {
      "header": [
        "Sep'25",
        "Sep'24",
        "Change(%)"
      ],
      "body": [
        {
          "field": "Net Sales",
          "val1": "146.74",
          "val2": "121.32",
          "chgp": "20.95%",
          "chgp_class": "positive"
        },
        {
          "field": "Operating Profit (PBDIT) excl Other Income",
          "val1": "22.08",
          "val2": "19.31",
          "chgp": "14.34%",
          "chgp_class": "positive"
        },
        {
          "field": "Interest",
          "val1": "0.16",
          "val2": "0.17",
          "chgp": "-5.88%",
          "chgp_class": "positive"
        },
        {
          "field": "Exceptional Items",
          "val1": "0.00",
          "val2": "0.00",
          "chgp": "",
          "chgp_class": "neutral"
        },
        {
          "field": "Standalone Net Profit",
          "val1": "13.93",
          "val2": "12.32",
          "chgp": "13.07%",
          "chgp_class": "positive"
        },
        {
          "field": "Operating Profit Margin (Excl OI)",
          "val1": "15.05%",
          "val2": "15.92%",
          "chgp": "-0.87%",
          "chgp_class": "negative"
        }
      ]
    }
  },
  {
    "link": "nine-monthly",
    "btn_text": "All Nine Monthly Results",
    "header": "Nine Monthly Results Snapshot (Standalone) - Dec'25",
    "rhs": [
      {
        "prefix": "Net Sales ",
        "suffix": "YoY Growth in nine months ended Dec 2025 is 28.16% vs 7.08% in Dec 2024",
        "dir": 1
      },
      {
        "prefix": "Standalone Net Profit ",
        "suffix": "YoY Growth in nine months ended Dec 2025 is 41.27% vs 10.32% in Dec 2024",
        "dir": 1
      }
    ],
    "table": {
      "header": [
        "Dec'25",
        "Dec'24",
        "Change(%)"
      ],
      "body": [
        {
          "field": "Net Sales",
          "val1": "232.89",
          "val2": "181.72",
          "chgp": "28.16%",
          "chgp_class": "positive"
        },
        {
          "field": "Operating Profit (PBDIT) excl Other Income",
          "val1": "37.66",
          "val2": "27.13",
          "chgp": "38.81%",
          "chgp_class": "positive"
        },
        {
          "field": "Interest",
          "val1": "0.87",
          "val2": "0.45",
          "chgp": "93.33%",
          "chgp_class": "negative"
        },
        {
          "field": "Exceptional Items",
          "val1": "0.00",
          "val2": "0.00",
          "chgp": "",
          "chgp_class": "neutral"
        },
        {
          "field": "Standalone Net Profit",
          "val1": "23.72",
          "val2": "16.79",
          "chgp": "41.27%",
          "chgp_class": "positive"
        },
        {
          "field": "Operating Profit Margin (Excl OI)",
          "val1": "16.17%",
          "val2": "14.93%",
          "chgp": "1.24%",
          "chgp_class": "positive"
        }
      ]
    }
  },
  {
    "link": "annual",
    "btn_text": "All Annual Results",
    "header": "Annual Results Snapshot (Standalone) - Mar'26",
    "rhs": [
      {
        "prefix": "Net Sales ",
        "suffix": "YoY Growth in year ended Mar 2026 is 27.26% vs 8.56% in Mar 2025",
        "dir": 1
      },
      {
        "prefix": "Standalone Net Profit ",
        "suffix": "YoY Growth in year ended Mar 2026 is 33.14% vs 5.56% in Mar 2025",
        "dir": 1
      }
    ],
    "table": {
      "header": [
        "Mar'26",
        "Mar'25",
        "Change(%)"
      ],
      "body": [
        {
          "field": "Net Sales",
          "val1": "333.18",
          "val2": "261.82",
          "chgp": "27.26%",
          "chgp_class": "positive"
        },
        {
          "field": "Operating Profit (PBDIT) excl Other Income",
          "val1": "53.91",
          "val2": "41.55",
          "chgp": "29.75%",
          "chgp_class": "positive"
        },
        {
          "field": "Interest",
          "val1": "1.57",
          "val2": "0.56",
          "chgp": "180.36%",
          "chgp_class": "negative"
        },
        {
          "field": "Exceptional Items",
          "val1": "0.00",
          "val2": "-0.77",
          "chgp": "100.00%",
          "chgp_class": "positive"
        },
        {
          "field": "Standalone Net Profit",
          "val1": "33.87",
          "val2": "25.44",
          "chgp": "33.14%",
          "chgp_class": "positive"
        },
        {
          "field": "Operating Profit Margin (Excl OI)",
          "val1": "16.18%",
          "val2": "15.87%",
          "chgp": "0.31%",
          "chgp_class": "positive"
        }
      ]
    }
  }
]

Quarterly Results Snapshot (Standalone) - Jun'26 - YoYstock-summary

Jun'26
Jun'25
Change(%)
Net Sales
95.24
61.03
56.05%
Operating Profit (PBDIT) excl Other Income
15.43
7.92
94.82%
Interest
0.49
0.10
390.00%
Exceptional Items
0.00
0.00
Standalone Net Profit
9.58
4.56
110.09%
Operating Profit Margin (Excl OI)
16.20%
12.98%
3.22%
Values in Rs Cr.
Direction Arrows
Net Sales

YoY Growth in quarter ended Jun 2026 is 56.05% vs 21.53% in Jun 2025

Direction Arrows
Standalone Net Profit

YoY Growth in quarter ended Jun 2026 is 110.09% vs 13.72% in Jun 2025

Half Yearly Results Snapshot (Standalone) - Sep'25stock-summary

Sep'25
Sep'24
Change(%)
Net Sales
146.74
121.32
20.95%
Operating Profit (PBDIT) excl Other Income
22.08
19.31
14.34%
Interest
0.16
0.17
-5.88%
Exceptional Items
0.00
0.00
Standalone Net Profit
13.93
12.32
13.07%
Operating Profit Margin (Excl OI)
15.05%
15.92%
-0.87%
Values in Rs Cr.
Direction Arrows
Net Sales

Growth in half year ended Sep 2025 is 20.95% vs 17.15% in Sep 2024

Direction Arrows
Standalone Net Profit

Growth in half year ended Sep 2025 is 13.07% vs 50.43% in Sep 2024

Nine Monthly Results Snapshot (Standalone) - Dec'25stock-summary

Dec'25
Dec'24
Change(%)
Net Sales
232.89
181.72
28.16%
Operating Profit (PBDIT) excl Other Income
37.66
27.13
38.81%
Interest
0.87
0.45
93.33%
Exceptional Items
0.00
0.00
Standalone Net Profit
23.72
16.79
41.27%
Operating Profit Margin (Excl OI)
16.17%
14.93%
1.24%
Values in Rs Cr.
Direction Arrows
Net Sales

YoY Growth in nine months ended Dec 2025 is 28.16% vs 7.08% in Dec 2024

Direction Arrows
Standalone Net Profit

YoY Growth in nine months ended Dec 2025 is 41.27% vs 10.32% in Dec 2024

Annual Results Snapshot (Standalone) - Mar'26stock-summary

Mar'26
Mar'25
Change(%)
Net Sales
333.18
261.82
27.26%
Operating Profit (PBDIT) excl Other Income
53.91
41.55
29.75%
Interest
1.57
0.56
180.36%
Exceptional Items
0.00
-0.77
100.00%
Standalone Net Profit
33.87
25.44
33.14%
Operating Profit Margin (Excl OI)
16.18%
15.87%
0.31%
Values in Rs Cr.
Direction Arrows
Net Sales

YoY Growth in year ended Mar 2026 is 27.26% vs 8.56% in Mar 2025

Direction Arrows
Standalone Net Profit

YoY Growth in year ended Mar 2026 is 33.14% vs 5.56% in Mar 2025

stock-summaryCompany CV
About Macpower CNC Machines Ltd stock-summary
stock-summary
Macpower CNC Machines Ltd
Micro Cap
Industrial Manufacturing
Macpower CNC Machines Limited was originally formed as a private limited Company in the name and style of `Macpower CNC Machines Private Limited' in Gujarat on December 31, 2003. Consequently, it was converted into a public limited company and the name of the Company was changed to `Macpower CNC Machines Limited' on November 16, 2017. The Company was founded by Mr. Rupesh Mehta.
Company Coordinates stock-summary
Company Details
Plot No 2234 Nr Krnati Gate, GIDC Metoda Tal Lodhika Rajkot Gujarat : 360007
stock-summary
Tel: 91-02827-287930
stock-summary
info@macpowercnc.com
Registrar Details
Link Intime India Pvt Ltd, C-13 Pannalal Silk Compound, L B S Marg, Bhandup , Mumbai