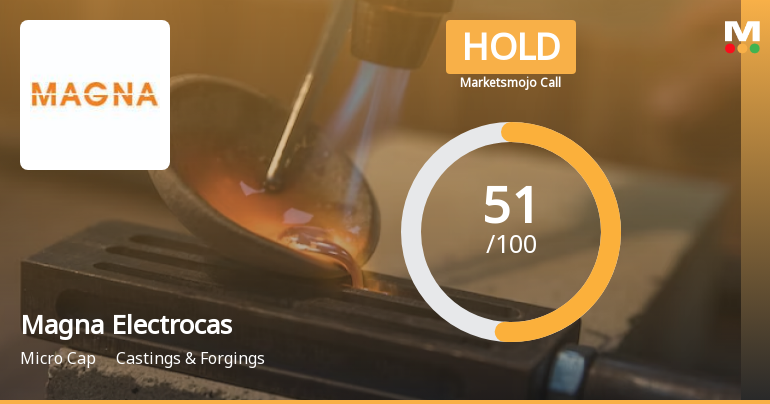
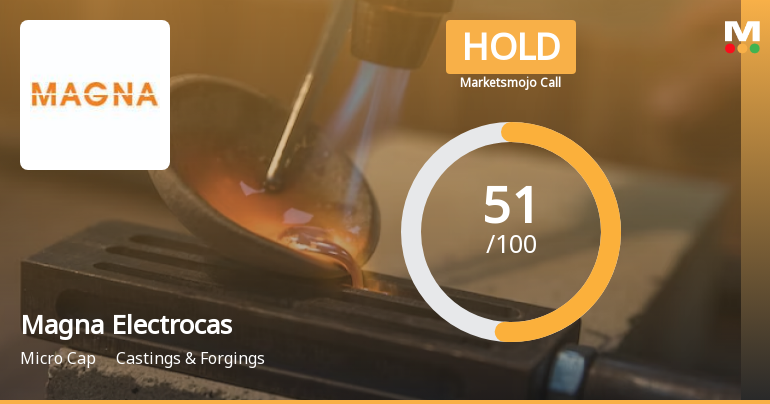
Magna Electrocas

  • Market Cap: Micro Cap
  • Industry: Castings & Forgings
  • ISIN: INE437D01010
  • NSEID:
  • BSEID: 517449
INR
1,323.35
5.1 (0.39%)
BSENSE

Sep 18, 03:30 PM

BSE+NSE Vol: 2.19 k

  • Price Points
  • Score
  • Mojo Parameters
  • Total Return
  • News and Corporate Actions
  • Key factors
  • Shareholding
  • Financials
  • CompanyCV
stock-summaryPrice Point
High/Low

1Day

52 Week

Valuation
Technical
Day's Volume

CASH

2.19 k (121.70%) Volume

Shareholding (Jun 2026)

FII

0.00%

Held by 1 FIIs

DII

0.02%

Held by 0 DIIs

Promoter

53.66%

Which are the latest news on Magna Electrocas?

18-Sep-2026

Why is Magna Electro Castings Ltd falling/rising?

06-Sep-2026

As of 05-Sep, Magna Electro Castings Ltd's stock price has risen to Rs 1,423.50, up 1.93%, driven by strong performance over the past week and month, as well as significant year-to-date gains. The stock is near its 52-week high and shows a bullish trend, supported by increased investor participation and favorable liquidity.

As of 05-Sep, Magna Electro Castings Ltd is experiencing a rise in its stock price, currently at Rs 1,423.50, reflecting an increase of Rs 26.9 or 1.93%. This upward movement can be attributed to several factors. Over the past week, the stock has gained 14.60%, significantly outperforming the Sensex, which has declined by 0.97%. In the last month, the stock has risen by 19.62%, while the Sensex has dropped by 2.44%. Year-to-date, Magna Electro Castings has shown a remarkable increase of 59.27%, contrasting sharply with the Sensex's decline of 10.21%.<BR><BR>Additionally, the stock is currently trading close to its 52-week high, just 4% away from Rs 1,470, and has outperformed its sector by 2.55% today. The stock has been on a consecutive gain streak for the last two days, accumulating a total return of 9.74% during this period. It also reached an intraday high of Rs 1,440, marking a 3.11% increase.<BR><BR>Moreover, the stock is trading above its 5-day, 20-day, 50-day, 100-day, and 200-day moving averages, indicating a strong bullish trend. Investor participation has risen, with a delivery volume of 3.55k on September 3, showing a significant increase of 124.02% compared to the 5-day average. The liquidity of the stock is also favorable, allowing for trades of Rs 0.01 crore based on 2% of the 5-day average traded value. All these factors contribute to the rising price of Magna Electro Castings Ltd.

View full answer

Who are in the management team of Magna Electrocas?

01-Sep-2026

The management team of Magna Electrocas includes N Krishna Samaraj (Managing Director), M Malmarugan (Executive Director), and several independent directors: K Gnanasekaran, R Nandini, Jairam Varadaraj, G D Rajkumar, and Vijayalakshni Narendra, along with non-executive director Ajeya Vel Narayanaswamy. This diverse team provides strong leadership and oversight for the company.

The management team of Magna Electrocas includes the following individuals:<BR><BR>1. **N Krishna Samaraj** - Managing Director<BR>2. **M Malmarugan** - Executive Director<BR>3. **J Vijayakumar** - Director<BR>4. **K Gnanasekaran** - Independent Director<BR>5. **R Nandini** - Independent Director<BR>6. **Jairam Varadaraj** - Independent Director<BR>7. **G D Rajkumar** - Independent Director<BR>8. **Ajeya Vel Narayanaswamy** - Non-Executive Director<BR>9. **Vijayalakshni Narendra** - Independent Director<BR><BR>This team brings a mix of leadership and independent oversight to the company.

View full answer

What does Magna Electrocas do?

01-Sep-2026

Magna Electro Castings Ltd manufactures and sells cast iron components in the castings and forgings industry. As of June 2026, it reported net sales of 51 Cr and a net profit of 4 Cr, with a market cap of INR 514 Cr.

Overview: <BR>Magna Electro Castings Ltd is engaged in the manufacturing and selling of Cast Iron Components within the Castings & Forgings industry, categorized as a Micro Cap company.<BR><BR>History: <BR>Incorporated in 1990 and promoted by N. Krishna Samaraj, the company has reported its latest quarterly results for June 2026, showcasing its operational status.<BR><BR>Financial Snapshot: <BR>Net Sales: 51 Cr (Quarterly Results - Jun 2026) <BR>Net Profit: 4 Cr (Quarterly Results - Jun 2026) <BR>Market Cap: INR 514 Cr (Micro Cap)<BR><BR>Key Metrics: <BR>P/E: 34.00 <BR>Industry P/E: 50 <BR>Dividend Yield: 0.48% <BR>Debt Equity: -0.01 <BR>Return on Equity: 10.72% <BR>Price to Book: 3.62<BR><BR>Contact Details: <BR>Address: 43 (Old No 62), Balasundaram Road Coimbatore Tamil Nadu : 641018 <BR>Tel: 91-422-2240109 <BR>Email: info@magnacast.com <BR>Website: http://www.magnacast.com

View full answer

Who are the peers of the Magna Electrocas?

01-Sep-2026

Magna Electrocas's peers include Inv.& Prec.Cast., Nelcast, Synergy Green, Kalyani Forge, Tirupati Forge, and ANB Metal. Magna Electrocas has excellent management and capital structure ratings, with average growth, while Kalyani Forge shows the highest 1-year return at 35.53%.

Peers: The peers of Magna Electrocas are Inv.& Prec.Cast., Nelcast, Synergy Green, Kalyani Forge, Tirupati Forge, and ANB Metal.<BR><BR>Quality Snapshot: Excellent management risk is observed at Magna Electrocas, while Average management risk is found at Inv.& Prec.Cast., Nelcast, Synergy Green, Kalyani Forge, Tirupati Forge, and ANB Metal. Growth ratings show that Magna Electrocas has Average growth, Kalyani Forge has Good growth, and Tirupati Forge has Excellent growth, while Inv.& Prec.Cast., Nelcast, and Synergy Green have Below Average growth. In terms of Capital Structure, Magna Electrocas stands out with an Excellent rating, while Inv.& Prec.Cast., Nelcast, Synergy Green, Kalyani Forge, and the rest have Below Average or Good ratings.<BR><BR>Return Snapshot: Kalyani Forge has the highest 1-year return at 35.53%, while Nelcast has the lowest at -19.11%. Magna Electrocas's 1-year return of 6.28% is higher than Nelcast's but lower than Kalyani Forge's. Additionally, peers such as Nelcast and Synergy Green have negative six-month returns.

View full answer

How big is Magna Electrocas?

01-Sep-2026

As of 31st August, Magna Electro Castings Ltd has a market capitalization of 514.00 Cr, with recent Net Sales of 198.73 Cr and a Net Profit of 15.55 Cr. Shareholder's Funds are 145.00 Cr and Total Assets are valued at 193.93 Cr as of March 2026.

As of 31st August, Magna Electro Castings Ltd has a market capitalization of 514.00 Cr, classified as a Micro Cap.<BR><BR>For the latest four quarters, the company reported Net Sales of 198.73 Cr and a Net Profit of 15.55 Cr.<BR><BR>As of March 2026, the Shareholder's Funds amounted to 145.00 Cr, while the Total Assets were valued at 193.93 Cr.

View full answer

Should I buy, sell or hold Magna Electro Castings Ltd?

15-Aug-2026

Are Magna Electro Castings Ltd latest results good or bad?

30-May-2026

Magna Electro Castings Ltd's latest results are concerning, with a 44.87% decline in net profit quarter-on-quarter and a contraction in operating margin to 13.76%, indicating significant operational challenges despite a slight year-on-year revenue growth. Overall, these results are considered bad, highlighting the need for improved expense management.

The latest results for Magna Electro Castings Ltd are concerning. In the quarter ending March 2026, the company reported a significant decline in net profit, which fell by 44.87% quarter-on-quarter and 44.81% year-on-year, resulting in a net profit of ₹2.66 crores. This marks the lowest profit level since September 2024.<BR><BR>While the company did achieve a year-on-year revenue growth of 4.61%, there was a sequential decline in sales of 0.77%, indicating operational challenges. The operating margin also contracted to 13.76%, the lowest in seven quarters, reflecting increased cost pressures, particularly from rising employee costs, which outpaced revenue growth.<BR><BR>Overall, the combination of declining profitability, margin compression, and rising costs raises significant concerns about the company's operational efficiency and ability to manage expenses effectively. This performance stands in stark contrast to the broader castings and forgings sector, which has been performing better. Therefore, the results can be characterized as bad, highlighting the need for the company to address these operational challenges moving forward.

View full answer

Is Magna Electrocas overvalued or undervalued?

28-Nov-2025

As of November 27, 2025, Magna Electrocas is considered undervalued with an attractive valuation grade, featuring a PE Ratio of 18.57 and a strong ROCE of 20.50%, especially when compared to peers like Bharat Forge and CIE Automotive, despite recent underperformance against the Sensex.

As of 27 November 2025, Magna Electrocas has moved from a fair to an attractive valuation grade. The company is currently considered undervalued based on its financial metrics. Key ratios include a PE Ratio of 18.57, an EV to EBITDA of 11.77, and a ROCE of 20.50%. <BR><BR>In comparison to peers, Bharat Forge has a significantly higher PE Ratio of 63.36, while CIE Automotive, which is also attractive, has a PE of 19.47. This indicates that Magna Electrocas is positioned favorably within its industry, particularly when considering its strong return on capital employed. Despite recent underperformance against the Sensex over the past year, the long-term returns of 129.90% over three years and 439.45% over five years suggest a robust growth trajectory that supports the current undervaluation narrative.

View full answer

How has been the historical performance of Magna Electrocas?

13-Nov-2025

Magna Electrocas has shown steady growth in net sales and profitability, with net sales reaching 176.45 Cr in March 2025, up from 143.70 Cr in March 2024. Key financial metrics, including operating profit and profit after tax, also improved significantly, reflecting a strong financial foundation.

Answer:<BR>The historical performance of Magna Electrocas shows a steady growth in net sales and profitability over the years, culminating in the fiscal year ending March 2025.<BR><BR>Breakdown:<BR>Magna Electrocas reported net sales of 176.45 Cr in March 2025, an increase from 143.70 Cr in March 2024 and 164.64 Cr in March 2023. The total operating income followed a similar trend, reaching 176.45 Cr in March 2025, up from 143.70 Cr in the previous year. The company's operating profit (PBDIT) also improved significantly, rising to 35.94 Cr in March 2025 from 24.97 Cr in March 2024. Profit before tax increased to 31.04 Cr in March 2025, compared to 20.41 Cr in March 2024, while profit after tax reached 23.12 Cr, up from 15.11 Cr. The earnings per share (EPS) saw a notable rise to 54.66 in March 2025 from 35.72 in March 2024. On the balance sheet, total assets increased to 182.71 Cr in March 2025, up from 128.43 Cr in March 2024, with total liabilities also rising to 182.71 Cr. The company maintained a strong book value per share of 305.53 in March 2025, reflecting its solid financial foundation. Cash flow from operating activities improved significantly to 39.00 Cr in March 2025, compared to 7.00 Cr in March 2024, although cash flow from investing activities showed a negative trend at -49.00 Cr. Overall, Magna Electrocas demonstrated robust growth in sales and profitability, alongside an increase in assets and shareholder equity.

View full answer

Is Magna Electrocas technically bullish or bearish?

26-Aug-2025

As of August 25, 2025, the trend is mildly bullish, supported by daily moving averages and monthly KST momentum, despite some caution from the weekly MACD, while the overall outlook remains positive due to bullish signals from the Bollinger Bands and Dow Theory.

As of 25 August 2025, the technical trend has changed from bullish to mildly bullish. The current stance is mildly bullish, driven by the daily moving averages indicating mild bullishness and the monthly KST showing bullish momentum. However, the weekly MACD is mildly bearish, which suggests some caution in the short term. The Bollinger Bands are bullish on the weekly timeframe, supporting the overall mildly bullish outlook. The Dow Theory indicates a bullish trend on the monthly timeframe, reinforcing the positive sentiment. Overall, while there are mixed signals, the strength of the bullish indicators on the monthly charts provides a favorable bias.

View full answer

Who are the top shareholders of the Magna Electrocas?

17-Jul-2025

The top shareholder of Magna Electrocas is N Krishnasamaraj Huf, holding 18.19%, with no pledged promoter holdings. Elgi Equipments Limited is the largest public shareholder at 1.57%, while individual investors own a total of 32.84% of the shares.

The top shareholders of Magna Electrocas include the promoters, with N Krishnasamaraj Huf being the individual with the highest holding at 18.19%. There are no pledged promoter holdings, and the company does not have any mutual funds or foreign institutional investors (FIIs) holding shares. The highest public shareholder is Elgi Equipments Limited, which holds 1.57%. Additionally, individual investors collectively hold 32.84% of the shares.

View full answer

When is the next results date for Magna Electrocas?

06-Jun-2025

No Upcoming Board Meetings

Has Magna Electrocas declared dividend?

06-Jun-2025

Yes, Magna Electro Castings Ltd has declared a 50% dividend, amounting to ₹5 per share, with an ex-date of August 9, 2024. The company has shown strong total returns over various periods, particularly in the long term.

Magna Electro Castings Ltd has declared a 50% dividend.<BR><BR>Dividend Details:<BR>- Percentage announced: 50%<BR>- Amount per share: 5<BR>- Ex-date: 09 Aug 24<BR><BR>Dividend Yield: 0.49%.<BR><BR>Total Returns by Period:<BR>In the 6-month period, the price return was -6.51%, with a dividend return of 0%, resulting in a total return of -6.51%.<BR><BR>For the 1-year period, the price return was 140.36%, the dividend return was 1.13%, leading to a total return of 141.49%.<BR><BR>Over the 2-year period, the price return was 218.36%, with a dividend return of 2.50%, culminating in a total return of 220.86%.<BR><BR>In the 3-year period, the price return was 496.22%, the dividend return was 6.02%, resulting in a total return of 502.24%.<BR><BR>For the 4-year period, the price return was 578.93%, with a dividend return of 6.90%, leading to a total return of 585.83%.<BR><BR>In the 5-year period, the price return was 902.47%, with a dividend return of 10.17%, culminating in a total return of 912.64%.<BR><BR>Overall, Magna Electro Castings Ltd has declared a significant dividend while showing strong total returns over various periods, particularly in the longer term, indicating a positive performance trend for investors.

View full answer
iScoreScore
Click here to find our call on this stock
Strong Sell
Sell
Hold
Buy
Strong Buy

Dashboard

1

The company is Net-Debt Free

 
2

The company has declared Negative results for the last 3 consecutive quarters

3

With ROE of 10.7, it has a Expensive valuation with a 3.9 Price to Book Value

4

Despite the size of the company, domestic mutual funds hold only 0% of the company

5

Consistent Returns over the last 3 years

stock-summaryMojo Parameters

Mojo Parameters

Loading Valuation Snapshot...

Stock DNA

stock-summary
Industry

Castings & Forgings

stock-summary
Market cap

INR 558 Cr (Micro Cap)

stock-summary
P/E

36.00

stock-summary
Industry P/E

47

stock-summary
Dividend Yield

0.38%

stock-summary
Debt Equity

-0.01

stock-summary
Return on Equity

10.72%

stock-summary
Price to Book

3.85

Revenue and Profits:
Net Sales:
51 Cr
(Quarterly Results - Jun 2026)
Net Profit:
4 Cr
stock-summaryTotal Returns
Total Returns (Price + Dividend) stock-summary
Dividend Yield (0.38%)
TimePeriod
Price Return
Dividend Return
Total Return
3 Months
20.41%
0.46%
20.87%
6 Months
45.49%
0.54%
46.03%
1 Year
17.03%
0.46%
17.49%
2 Years
76.21%
1.36%
77.57%
3 Years
158.67%
3.18%
161.85%
4 Years
303.4%
5.60%
309.0%
5 Years
672.98%
12.38%
685.36%

Latest dividend: 4.915839694656489 per share ex-dividend date: Sep-02-2026

Risk Adjusted Returns v/s stock-summary
Returns Beta
Icon
Beta has not been calculated since enough price history is not available
stock-summaryNews & Corporate Actions

News

Magna Electro Castings Ltd Falls 1.93%: 3 Key Factors Driving the Weekly Move

Announcements stock-summary

Shareholder Meeting / Postal Ballot-Scrutinizers Report

10-Sep-2026 | Source : BSE

Disclosure of Voting results of the 36th AGM of the Company held on 9th September 2026 along with Scrutinizers Report.

Shareholder Meeting / Postal Ballot-Outcome of AGM

09-Sep-2026 | Source : BSE

Enclosed 36th AGM proceedings.

Announcement under Regulation 30 (LODR)-Newspaper Publication

14-Aug-2026 | Source : BSE

Please find enclosed newspaper publication for Unaudited Financial Results for the quarter ended 30th June 2026.

Corporate Actions stock-summary

stock-summary
BOARD MEETING

No Upcoming Board Meetings

stock-summary
DIVIDEND

Magna Electro Castings Ltd has declared 50% dividend, ex-date: 02 Sep 26

stock-summary
SPLITS

No Splits history available

stock-summary
BONUS

No Bonus history available

stock-summary
RIGHTS

No Rights history available

stock-summaryKey Factors

Quality key factors stock-summary

Factor
Value
Sales Growth (5y)
14.12%
EBIT Growth (5y)
31.56%
EBIT to Interest (avg)
20.05
Debt to EBITDA (avg)
0.18
Net Debt to Equity (avg)
-0.01
Sales to Capital Employed (avg)
1.46
Tax Ratio
27.01%
Dividend Payout Ratio
10.98%
Pledged Shares
0
Institutional Holding
0.03%
ROCE (avg)
20.09%
ROE (avg)
14.52%

Valuation key factors

Factor
Value
P/E Ratio
36
Industry P/E
47
Price to Book Value
3.91
EV to EBIT
27.45
EV to EBITDA
18.37
EV to Capital Employed
3.93
EV to Sales
2.85
PEG Ratio
NA
Dividend Yield
0.37%
ROCE (Latest)
16.86%
ROE (Latest)
10.72%

Technicals key factors

Indicator
Weekly
Monthly
MACD
Bullish
Bullish
RSI
No Signal
No Signal
Bollinger Bands
Mildly Bullish
Bullish
Moving Averages
Bullish (Daily)
KST
Bullish
Mildly Bearish
Dow Theory
Mildly Bullish
No Trend
stock-summary Technical Indicator Scale: Bearish, Mildly Bearish, Sideways, Mildly Bullish, Bullish  Turned 
stock-summaryShareholding
Shareholding Snapshot : Jun 2026stock-summary
Shareholding Compare (%holding) stock-summary
Majority shareholders

Promoters

Pledged Promoter Holdings

None

Mutual Funds

Held by 0 Schemes

FIIs

Held by 1 FIIs (0.0%)

Promoter with highest holding

N Krishnasamaraj Huf (18.19%)

Highest Public shareholder

Investor Education And Protection Fund Authority Ministry Of Corporate Affairs (2.65%)

Individual Investors Holdings

31.96%

stock-summaryFinancial
[
  {
    "link": "quarterly",
    "btn_text": "All Quarterly Results",
    "header": "Quarterly Results Snapshot (Standalone) - Jun'26 - QoQ",
    "rhs": [
      {
        "prefix": "Net Sales ",
        "suffix": "QoQ Growth in quarter ended Jun 2026 is 6.72% vs -0.77% in Mar 2026",
        "dir": 1
      },
      {
        "prefix": "Standalone Net Profit ",
        "suffix": "QoQ Growth in quarter ended Jun 2026 is 40.23% vs -29.07% in Mar 2026",
        "dir": 1
      }
    ],
    "table": {
      "header": [
        "Jun'26",
        "Mar'26",
        "Change(%)"
      ],
      "body": [
        {
          "field": "Net Sales",
          "val1": "50.81",
          "val2": "47.61",
          "chgp": "6.72%",
          "chgp_class": "positive"
        },
        {
          "field": "Operating Profit (PBDIT) excl Other Income",
          "val1": "7.44",
          "val2": "6.55",
          "chgp": "13.59%",
          "chgp_class": "positive"
        },
        {
          "field": "Interest",
          "val1": "0.29",
          "val2": "0.42",
          "chgp": "-30.95%",
          "chgp_class": "positive"
        },
        {
          "field": "Exceptional Items",
          "val1": "0.00",
          "val2": "0.00",
          "chgp": "",
          "chgp_class": "neutral"
        },
        {
          "field": "Standalone Net Profit",
          "val1": "3.73",
          "val2": "2.66",
          "chgp": "40.23%",
          "chgp_class": "positive"
        },
        {
          "field": "Operating Profit Margin (Excl OI)",
          "val1": "14.64%",
          "val2": "13.76%",
          "chgp": "0.88%",
          "chgp_class": "positive"
        }
      ]
    }
  },
  {
    "link": "half-yearly",
    "btn_text": "All Half Yearly Results",
    "header": "Half Yearly Results Snapshot (Standalone) - Sep'25",
    "rhs": [
      {
        "prefix": "Net Sales ",
        "suffix": " Growth in half year ended Sep 2025 is 14.86% vs 21.61% in Sep 2024",
        "dir": -1
      },
      {
        "prefix": "Standalone Net Profit ",
        "suffix": " Growth in half year ended Sep 2025 is -10.19% vs 79.44% in Sep 2024",
        "dir": -1
      }
    ],
    "table": {
      "header": [
        "Sep'25",
        "Sep'24",
        "Change(%)"
      ],
      "body": [
        {
          "field": "Net Sales",
          "val1": "100.85",
          "val2": "87.80",
          "chgp": "14.86%",
          "chgp_class": "positive"
        },
        {
          "field": "Operating Profit (PBDIT) excl Other Income",
          "val1": "19.24",
          "val2": "19.36",
          "chgp": "-0.62%",
          "chgp_class": "negative"
        },
        {
          "field": "Interest",
          "val1": "0.25",
          "val2": "0.02",
          "chgp": "1,150.00%",
          "chgp_class": "negative"
        },
        {
          "field": "Exceptional Items",
          "val1": "0.00",
          "val2": "0.00",
          "chgp": "",
          "chgp_class": "neutral"
        },
        {
          "field": "Standalone Net Profit",
          "val1": "12.07",
          "val2": "13.44",
          "chgp": "-10.19%",
          "chgp_class": "negative"
        },
        {
          "field": "Operating Profit Margin (Excl OI)",
          "val1": "19.08%",
          "val2": "22.05%",
          "chgp": "-2.97%",
          "chgp_class": "negative"
        }
      ]
    }
  },
  {
    "link": "nine-monthly",
    "btn_text": "All Nine Monthly Results",
    "header": "Nine Monthly Results Snapshot (Standalone) - Dec'25",
    "rhs": [
      {
        "prefix": "Net Sales ",
        "suffix": "YoY Growth in nine months ended Dec 2025 is 13.66% vs 21.97% in Dec 2024",
        "dir": -1
      },
      {
        "prefix": "Standalone Net Profit ",
        "suffix": "YoY Growth in nine months ended Dec 2025 is -13.55% vs 66.06% in Dec 2024",
        "dir": -1
      }
    ],
    "table": {
      "header": [
        "Dec'25",
        "Dec'24",
        "Change(%)"
      ],
      "body": [
        {
          "field": "Net Sales",
          "val1": "148.83",
          "val2": "130.94",
          "chgp": "13.66%",
          "chgp_class": "positive"
        },
        {
          "field": "Operating Profit (PBDIT) excl Other Income",
          "val1": "26.59",
          "val2": "26.78",
          "chgp": "-0.71%",
          "chgp_class": "negative"
        },
        {
          "field": "Interest",
          "val1": "0.56",
          "val2": "0.10",
          "chgp": "460.00%",
          "chgp_class": "negative"
        },
        {
          "field": "Exceptional Items",
          "val1": "0.00",
          "val2": "0.00",
          "chgp": "",
          "chgp_class": "neutral"
        },
        {
          "field": "Standalone Net Profit",
          "val1": "15.82",
          "val2": "18.30",
          "chgp": "-13.55%",
          "chgp_class": "negative"
        },
        {
          "field": "Operating Profit Margin (Excl OI)",
          "val1": "17.87%",
          "val2": "20.45%",
          "chgp": "-2.58%",
          "chgp_class": "negative"
        }
      ]
    }
  },
  {
    "link": "annual",
    "btn_text": "All Annual Results",
    "header": "Annual Results Snapshot (Standalone) - Mar'26",
    "rhs": [
      {
        "prefix": "Net Sales ",
        "suffix": "YoY Growth in year ended Mar 2026 is 11.33% vs 22.79% in Mar 2025",
        "dir": -1
      },
      {
        "prefix": "Standalone Net Profit ",
        "suffix": "YoY Growth in year ended Mar 2026 is -20.11% vs 53.01% in Mar 2025",
        "dir": -1
      }
    ],
    "table": {
      "header": [
        "Mar'26",
        "Mar'25",
        "Change(%)"
      ],
      "body": [
        {
          "field": "Net Sales",
          "val1": "196.44",
          "val2": "176.45",
          "chgp": "11.33%",
          "chgp_class": "positive"
        },
        {
          "field": "Operating Profit (PBDIT) excl Other Income",
          "val1": "33.14",
          "val2": "34.21",
          "chgp": "-3.13%",
          "chgp_class": "negative"
        },
        {
          "field": "Interest",
          "val1": "0.99",
          "val2": "0.27",
          "chgp": "266.67%",
          "chgp_class": "negative"
        },
        {
          "field": "Exceptional Items",
          "val1": "0.00",
          "val2": "0.00",
          "chgp": "",
          "chgp_class": "neutral"
        },
        {
          "field": "Standalone Net Profit",
          "val1": "18.47",
          "val2": "23.12",
          "chgp": "-20.11%",
          "chgp_class": "negative"
        },
        {
          "field": "Operating Profit Margin (Excl OI)",
          "val1": "16.87%",
          "val2": "19.39%",
          "chgp": "-2.52%",
          "chgp_class": "negative"
        }
      ]
    }
  }
]

Quarterly Results Snapshot (Standalone) - Jun'26 - QoQstock-summary

Jun'26
Mar'26
Change(%)
Net Sales
50.81
47.61
6.72%
Operating Profit (PBDIT) excl Other Income
7.44
6.55
13.59%
Interest
0.29
0.42
-30.95%
Exceptional Items
0.00
0.00
Standalone Net Profit
3.73
2.66
40.23%
Operating Profit Margin (Excl OI)
14.64%
13.76%
0.88%
Values in Rs Cr.
Direction Arrows
Net Sales

QoQ Growth in quarter ended Jun 2026 is 6.72% vs -0.77% in Mar 2026

Direction Arrows
Standalone Net Profit

QoQ Growth in quarter ended Jun 2026 is 40.23% vs -29.07% in Mar 2026

Half Yearly Results Snapshot (Standalone) - Sep'25stock-summary

Sep'25
Sep'24
Change(%)
Net Sales
100.85
87.80
14.86%
Operating Profit (PBDIT) excl Other Income
19.24
19.36
-0.62%
Interest
0.25
0.02
1,150.00%
Exceptional Items
0.00
0.00
Standalone Net Profit
12.07
13.44
-10.19%
Operating Profit Margin (Excl OI)
19.08%
22.05%
-2.97%
Values in Rs Cr.
Direction Arrows
Net Sales

Growth in half year ended Sep 2025 is 14.86% vs 21.61% in Sep 2024

Direction Arrows
Standalone Net Profit

Growth in half year ended Sep 2025 is -10.19% vs 79.44% in Sep 2024

Nine Monthly Results Snapshot (Standalone) - Dec'25stock-summary

Dec'25
Dec'24
Change(%)
Net Sales
148.83
130.94
13.66%
Operating Profit (PBDIT) excl Other Income
26.59
26.78
-0.71%
Interest
0.56
0.10
460.00%
Exceptional Items
0.00
0.00
Standalone Net Profit
15.82
18.30
-13.55%
Operating Profit Margin (Excl OI)
17.87%
20.45%
-2.58%
Values in Rs Cr.
Direction Arrows
Net Sales

YoY Growth in nine months ended Dec 2025 is 13.66% vs 21.97% in Dec 2024

Direction Arrows
Standalone Net Profit

YoY Growth in nine months ended Dec 2025 is -13.55% vs 66.06% in Dec 2024

Annual Results Snapshot (Standalone) - Mar'26stock-summary

Mar'26
Mar'25
Change(%)
Net Sales
196.44
176.45
11.33%
Operating Profit (PBDIT) excl Other Income
33.14
34.21
-3.13%
Interest
0.99
0.27
266.67%
Exceptional Items
0.00
0.00
Standalone Net Profit
18.47
23.12
-20.11%
Operating Profit Margin (Excl OI)
16.87%
19.39%
-2.52%
Values in Rs Cr.
Direction Arrows
Net Sales

YoY Growth in year ended Mar 2026 is 11.33% vs 22.79% in Mar 2025

Direction Arrows
Standalone Net Profit

YoY Growth in year ended Mar 2026 is -20.11% vs 53.01% in Mar 2025

stock-summaryCompany CV
About Magna Electro Castings Ltd stock-summary
stock-summary
Magna Electro Castings Ltd
Micro Cap
Castings & Forgings
Magna Electro Castings Limited was incorporated in 1990. It was promoted and managed by N. Krishna Samaraj. The Company is mainly engaged in manufacturing and selling of Cast Iron Components. In 2001 the company has successfully commissioned its state of the art CAD/CAM Centre for producing tooling. The Company had implemented a Energy Conservation Project in 2001-02 at a cost of Rs.110 lakhs and was funded by internal accruals and term loans from Corporation Bank.
Company Coordinates stock-summary
Company Details
43 (Old No 62), Balasundaram Road Coimbatore Tamil Nadu : 641018
stock-summary
Tel: 91-422-2240109
stock-summary
info@magnacast.com
Registrar Details
SKDC Consultants Ltd , Kanapathy Towers, 3rd Floor, Ganapathy, Coimbatore