
Compare Magnus Steel with Similar Stocks
Dashboard
Healthy long term growth as Net Sales has grown by an annual rate of 378.60% and Operating profit at 141.04%
With a growth in Net Profit of 590.91%, the company declared Very Positive results in Mar 26
With ROCE of 90.7, it has a Very Expensive valuation with a 85.6 Enterprise value to Capital Employed
Majority shareholders : Non Institution
Stock DNA
Other Electrical Equipment
INR 438 Cr (Micro Cap)
97.00
49
0.00%
0.52
133.04%
123.10
Total Returns (Price + Dividend) 
Magnus Steel for the last several years.
Risk Adjusted Returns v/s
Returns Beta

News
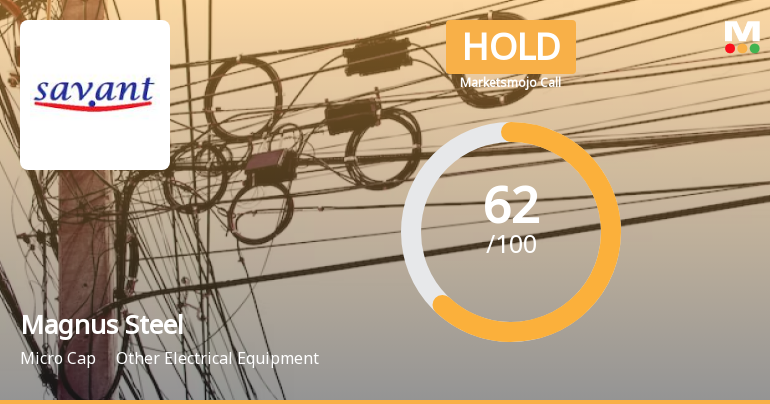
Magnus Steel & Infra Ltd is Rated Hold
Magnus Steel & Infra Ltd is rated 'Hold' by MarketsMOJO, with this rating last updated on 11 June 2026. However, the analysis and financial metrics discussed here reflect the stock's current position as of 23 June 2026, providing investors with an up-to-date view of its performance and prospects.
Read full news article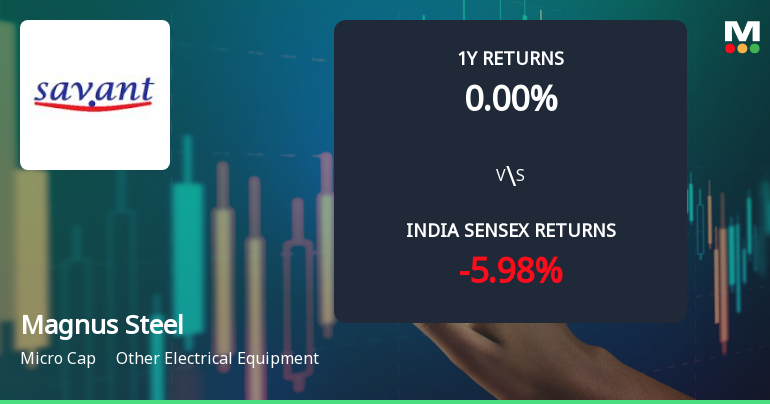
Magnus Steel & Infra Ltd Sees Technical Momentum Shift Amid Mixed Market Signals
Magnus Steel & Infra Ltd, a micro-cap player in the Other Electrical Equipment sector, has experienced a notable shift in its technical momentum, moving from a bullish to a mildly bullish stance. Despite a sharp day decline of 4.97% to close at ₹113.80, the stock’s technical indicators present a complex picture, with mixed signals across weekly and monthly timeframes. This article analyses the recent technical parameter changes, key momentum indicators, and the implications for investors amid broader market trends.
Read full news article
Magnus Steel & Infra Ltd Technical Momentum Shifts Amid Mixed Market Signals
Magnus Steel & Infra Ltd, a micro-cap player in the Other Electrical Equipment sector, has experienced a notable shift in its technical momentum, moving from a mildly bullish stance to a more confident bullish trend. Despite a 5.00% decline in the latest session, the stock’s technical indicators reveal a complex interplay of signals that investors should carefully analyse to gauge future price action.
Read full news article Announcements
Announcement under Regulation 30 (LODR)-Award_of_Order_Receipt_of_Order
25-Jun-2026 | Source : BSEIntimation under Regulation 30 of SEBI (Listing Obligations and Disclosure Requirements) Regulations 2015 - Commission Income from Brokerage and Transaction Facilitation Services
Compliances-Reg.24(A)-Annual Secretarial Compliance
26-May-2026 | Source : BSEPlease refer the attached intimation
Submission Of Revised Outcome Of Board Meeting - Financial Results
22-May-2026 | Source : BSEPlease refer the attached intimation
Corporate Actions

No Upcoming Board Meetings

No Dividend history available

No Splits history available

No Bonus history available

Magnus Steel & Infra Ltd has announced 29:2 rights issue, ex-date: 10 Oct 25
Quality key factors
Valuation key factors
Technicals key factors
 Technical Indicator Scale: Bearish, Mildly Bearish, Sideways, Mildly Bullish, Bullish Turned
 Shareholding Snapshot : Mar 2026
Shareholding Compare (%holding)
Non Institution
None
Held by 0 Schemes
Held by 0 FIIs
Aditya Naresh Bajaj (23.8%)
None
52.73%
Quarterly Results Snapshot (Standalone) - Mar'26 - YoY

YoY Growth in quarter ended Mar 2026 is 385.71% vs 119.40% in Mar 2025
YoY Growth in quarter ended Mar 2026 is 590.91% vs 344.44% in Mar 2025
Half Yearly Results Snapshot (Standalone) - Sep'25
Growth in half year ended Sep 2025 is 437.21% vs 0.00% in Sep 2024
Growth in half year ended Sep 2025 is 1,464.29% vs 26.32% in Sep 2024
Nine Monthly Results Snapshot (Standalone) - Dec'25
YoY Growth in nine months ended Dec 2025 is 348.84% vs -51.82% in Dec 2024
YoY Growth in nine months ended Dec 2025 is 1,096.67% vs -122.56% in Dec 2024
Annual Results Snapshot (Standalone) - Mar'26
YoY Growth in year ended Mar 2026 is 607.84% vs 376.12% in Mar 2025
YoY Growth in year ended Mar 2026 is 7,416.67% vs 115.79% in Mar 2025
About Magnus Steel & Infra Ltd

Company Coordinates


