
Compare Magnus Steel with Similar Stocks
Dashboard
Healthy long term growth as Net Sales has grown by an annual rate of 378.60% and Operating profit at 141.04%
With a growth in Net Profit of 590.91%, the company declared Very Positive results in Mar 26
With ROCE of 90.7, it has a Very Expensive valuation with a 122.4 Enterprise value to Capital Employed
Despite the size of the company, domestic mutual funds hold only 0% of the company
Stock DNA
Other Electrical Equipment
INR 627 Cr (Micro Cap)
139.00
47
0.00%
0.52
133.04%
194.82
Total Returns (Price + Dividend) 
Magnus Steel for the last several years.
Risk Adjusted Returns v/s
Returns Beta

News
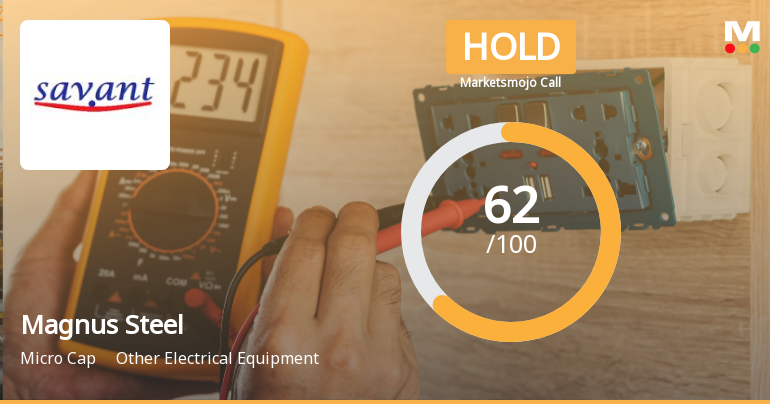
Magnus Steel & Infra Ltd Downgraded to Hold Amid Mixed Technical and Valuation Signals
Magnus Steel & Infra Ltd, a micro-cap player in the Other Electrical Equipment sector, has seen its investment rating downgraded from Buy to Hold as of 11 June 2026. This adjustment follows a detailed reassessment across four key parameters: Quality, Valuation, Financial Trend, and Technicals. Despite the company’s impressive financial performance and market-beating returns, evolving technical indicators and valuation concerns have tempered the overall outlook.
Read full news article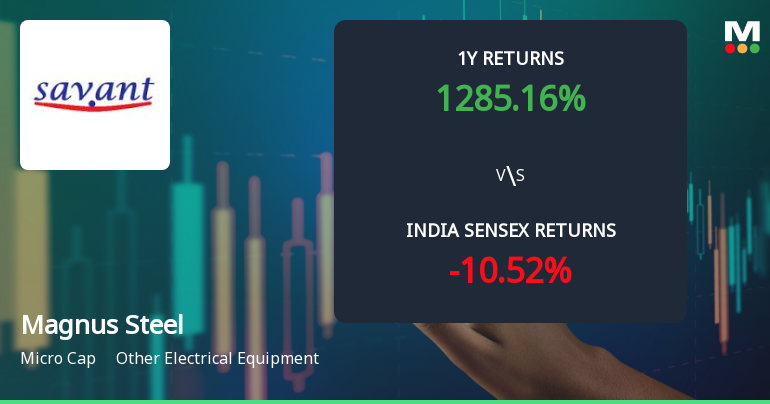
Magnus Steel & Infra Ltd Sees Mixed Technical Signals Amid Price Momentum Shift
Magnus Steel & Infra Ltd has experienced a notable shift in its technical parameters, reflecting a nuanced change in price momentum. While the stock’s daily price surged 5.00% to close at ₹126.05 on 12 Jun 2026, technical indicators present a mixed picture, signalling a transition from a bullish to a mildly bullish trend. This article analyses the recent technical developments, key momentum indicators, and the stock’s performance relative to broader market benchmarks.
Read full news article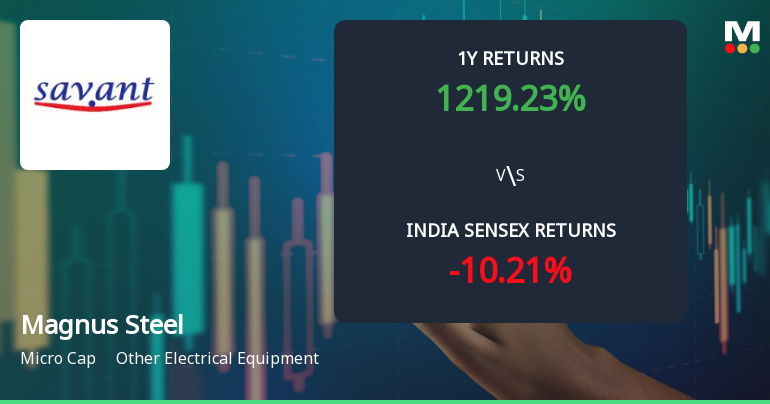
Magnus Steel & Infra Ltd Technical Momentum Shifts Signal Bullish Outlook
Magnus Steel & Infra Ltd has demonstrated a notable shift in technical momentum, with key indicators signalling an increasingly bullish trend. The micro-cap stock, operating within the Other Electrical Equipment sector, has seen its MarketsMOJO grade upgraded from Hold to Buy as of 5 June 2026, reflecting improved market sentiment and technical strength amid a strong price recovery.
Read full news article Announcements
Compliances-Reg.24(A)-Annual Secretarial Compliance
26-May-2026 | Source : BSEPlease refer the attached intimation
Submission Of Revised Outcome Of Board Meeting - Financial Results
22-May-2026 | Source : BSEPlease refer the attached intimation
Announcement under Regulation 30 (LODR)-Award_of_Order_Receipt_of_Order
11-May-2026 | Source : BSEPlease refer the attached intimation
Corporate Actions

No Upcoming Board Meetings

No Dividend history available

No Splits history available

No Bonus history available

Magnus Steel & Infra Ltd has announced 29:2 rights issue, ex-date: 10 Oct 25
Quality key factors
Valuation key factors
Technicals key factors
 Technical Indicator Scale: Bearish, Mildly Bearish, Sideways, Mildly Bullish, Bullish Turned
 Shareholding Snapshot : Mar 2026
Shareholding Compare (%holding)
Non Institution
None
Held by 0 Schemes
Held by 0 FIIs
Aditya Naresh Bajaj (23.8%)
None
52.73%
Quarterly Results Snapshot (Standalone) - Mar'26 - YoY

YoY Growth in quarter ended Mar 2026 is 385.71% vs 119.40% in Mar 2025
YoY Growth in quarter ended Mar 2026 is 590.91% vs 344.44% in Mar 2025
Half Yearly Results Snapshot (Standalone) - Sep'25
Growth in half year ended Sep 2025 is 437.21% vs 0.00% in Sep 2024
Growth in half year ended Sep 2025 is 1,464.29% vs 26.32% in Sep 2024
Nine Monthly Results Snapshot (Standalone) - Dec'25
YoY Growth in nine months ended Dec 2025 is 348.84% vs -51.82% in Dec 2024
YoY Growth in nine months ended Dec 2025 is 1,096.67% vs -122.56% in Dec 2024
Annual Results Snapshot (Standalone) - Mar'26
YoY Growth in year ended Mar 2026 is 607.84% vs 376.12% in Mar 2025
YoY Growth in year ended Mar 2026 is 7,416.67% vs 115.79% in Mar 2025
About Magnus Steel & Infra Ltd

Company Coordinates


