
Compare Maha Rashtra Apx with Similar Stocks
Dashboard
With a Operating Losses, the company has a Weak Long Term Fundamental Strength
- PBT LESS OI(Q) At Rs -4.99 cr has Fallen at -267.7% (vs previous 4Q average)
- PAT(Q) At Rs -5.06 cr has Fallen at -274.7% (vs previous 4Q average)
- PBDIT(Q) Lowest at Rs -0.49 cr.
With ROE of -1.6, it has a Very Expensive valuation with a 0.3 Price to Book Value
Consistent Underperformance against the benchmark over the last 3 years
Stock DNA
Non Banking Financial Company (NBFC)
INR 127 Cr (Micro Cap)
NA (Loss Making)
21
0.00%
0.00
-1.64%
0.27
Total Returns (Price + Dividend) 
Maha Rashtra Apx for the last several years.
Risk Adjusted Returns v/s
Returns Beta

News

Maha Rashtra Apex Corporation Ltd is Rated Strong Sell
Maha Rashtra Apex Corporation Ltd is rated Strong Sell by MarketsMOJO, with this rating last updated on 20 March 2026. However, the analysis and financial metrics discussed here reflect the stock’s current position as of 30 July 2026, providing investors with an up-to-date view of the company’s fundamentals, valuation, financial trends, and technical outlook.
Read full news article
Maha Rashtra Apex Corporation Ltd is Rated Strong Sell
Maha Rashtra Apex Corporation Ltd is rated Strong Sell by MarketsMOJO, with this rating last updated on 20 March 2026. However, the analysis and financial metrics presented here reflect the company’s current position as of 19 July 2026, providing investors with the latest insights into its performance and outlook.
Read full news article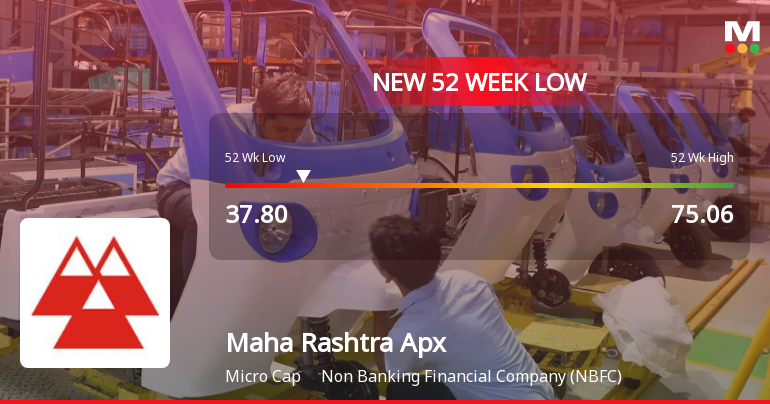
Maha Rashtra Apex Corporation Ltd Falls to 52-Week Low Amidst Prolonged Downtrend
For the third consecutive session, Maha Rashtra Apex Corporation Ltd has extended its losses, slipping to a fresh 52-week low on 09 Jul 2026, closing at a level that underscores persistent selling pressure despite a broadly positive market backdrop.
Read full news article Announcements
Board Meeting Outcome for Outcome Of Board Meeting Held On 24Th July 2026
24-Jul-2026 | Source : BSEOutcome of Board Meeting held on 24th July 2026
Corrigendum To The Outcome Of The Board Meeting Dated 08Th June 2026
09-Jul-2026 | Source : BSEWe refer to Outcome of Board Meeting Dated 08th June 2026 wherein due to inadvertent typhographical error date of Board Meeting in the body of letter was mentioned as 08th August 2026. kindly read as 08th June 2026.
Compliances-Certificate under Reg. 74 (5) of SEBI (DP) Regulations 2018
03-Jul-2026 | Source : BSEAttached Compliance Certificate under Regulation 74 (5) of SEBI (DP) Regulations 2018 for the quarter ended 30th June2026.
Corporate Actions

No Upcoming Board Meetings

No Dividend history available

No Splits history available

No Bonus history available

Maha Rashtra Apex Corporation Ltd has announced 1:1 rights issue, ex-date: 20 Mar 26
Quality key factors
Valuation key factors
Technicals key factors
 Technical Indicator Scale: Bearish, Mildly Bearish, Sideways, Mildly Bullish, Bullish Turned
 Shareholding Snapshot : Jun 2026
Shareholding Compare (%holding)
Promoters
None
Held by 0 Schemes
Held by 0 FIIs
Manipal Holdings Private Limited (20.38%)
Kailashben Ashokkumar Patel (1.02%)
24.42%
Quarterly Results Snapshot (Consolidated) - Mar'26 - QoQ

QoQ Growth in quarter ended Mar 2026 is -96.95% vs 3,183.33% in Dec 2025
QoQ Growth in quarter ended Mar 2026 is -201.02% vs 116.00% in Dec 2025
Half Yearly Results Snapshot (Consolidated) - Sep'25

Growth in half year ended Sep 2025 is 90.10% vs -15.83% in Sep 2024
Growth in half year ended Sep 2025 is -267.98% vs 44.48% in Sep 2024
Nine Monthly Results Snapshot (Consolidated) - Dec'25
YoY Growth in nine months ended Dec 2025 is 266.98% vs -42.08% in Dec 2024
YoY Growth in nine months ended Dec 2025 is 30.29% vs 96.85% in Dec 2024
Annual Results Snapshot (Consolidated) - Mar'26
YoY Growth in year ended Mar 2026 is 57.35% vs -84.39% in Mar 2025
YoY Growth in year ended Mar 2026 is -134.94% vs -94.07% in Mar 2025
About Maha Rashtra Apex Corporation Ltd

Company Coordinates


