
Compare Mahalaxmi Fab. with Similar Stocks
Dashboard
Weak Long Term Fundamental Strength with a -3.30% CAGR growth in Net Sales over the last 5 years
- Low ability to service debt as the company has a high Debt to EBITDA ratio of 8.29 times
- The company has been able to generate a Return on Equity (avg) of 3.78% signifying low profitability per unit of shareholders funds
Below par performance in long term as well as near term
Stock DNA
Garments & Apparels
INR 23 Cr (Micro Cap)
3.00
NA
0.00%
0.59
7.56%
0.23
Total Returns (Price + Dividend) 
Mahalaxmi Fab. for the last several years.
Risk Adjusted Returns v/s
Returns Beta

News
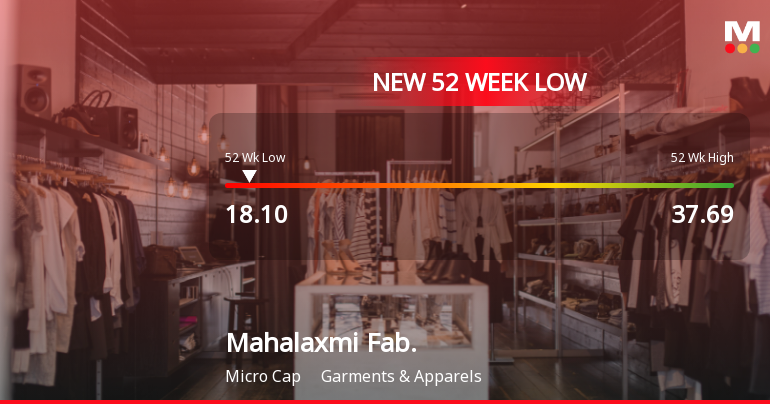
Mahalaxmi Fabric Mills Ltd Falls to 52-Week Low of Rs 18.1 as Sell-Off Deepens
For the fifth consecutive session, Mahalaxmi Fabric Mills Ltd closed lower, plunging to a fresh 52-week low of Rs 18.1 on 2 Jul 2026. This marks a steep 23.97% decline over the past five days, underscoring persistent selling pressure despite a broadly rising market backdrop.
Read full news article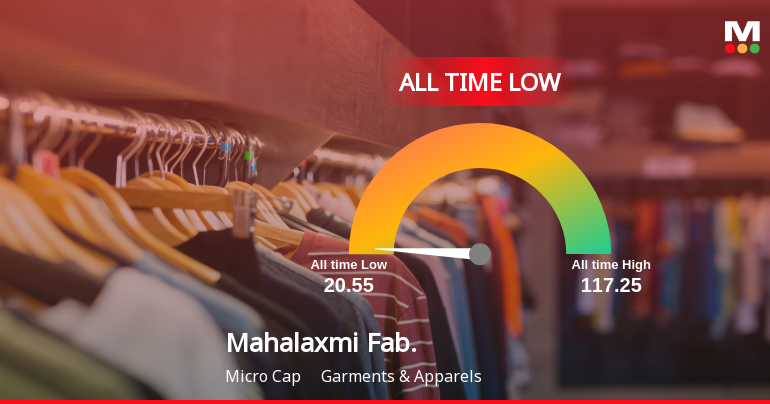
Mahalaxmi Fabric Mills Ltd Extends Losing Streak to 5 Sessions, Touches All-Time Low
For the fifth consecutive session, Mahalaxmi Fabric Mills Ltd closed sharply lower, hitting a fresh all-time low of Rs 19.00 on 2 Jul 2026. This persistent decline has pushed the stock close to its 52-week low of Rs 20.55, underscoring a challenging period for the garment and apparel company amid broader market resilience.
Read full news article
Mahalaxmi Fabric Mills Q4 FY26: Profitability Returns Amid Operational Volatility
Mahalaxmi Fabric Mills Limited, a micro-cap garments and apparels manufacturer with a market capitalisation of ₹25.00 crores, delivered a return to profitability in Q4 FY26 after two consecutive quarters of losses, reporting net profit of ₹1.55 crores. However, the quarterly performance remained volatile, with the company swinging from a loss of ₹0.76 crores in Q3 FY26 to profit in the latest quarter. Following the results, the stock surged 9.51% to close at ₹25.57 on May 29, 2026, though it remains 14.19% below its price a year ago.
Read full news article Announcements
Closure of Trading Window
27-Jun-2026 | Source : BSEIntimation regarding trading window closure from Wednesday July 1 2026 for designated person and their relatives till the expiry of 48 hours after the declaration of the financial results for the 1st quarter ending on June 30 2026.
Announcement under Regulation 30 (LODR)-Newspaper Publication
29-May-2026 | Source : BSEWe wish to inform you that the Audited Financial Results for the 4th quarter and year ended on March 31 2026 has been published in the newspaper.
Appointment Of Tax Auditor And Internal Auditor
28-May-2026 | Source : BSEAppointment of Tax Auditors and Internal Auditors
Corporate Actions

No Upcoming Board Meetings

No Dividend history available

No Splits history available

No Bonus history available

No Rights history available
Quality key factors
Valuation key factors
Technicals key factors
 Technical Indicator Scale: Bearish, Mildly Bearish, Sideways, Mildly Bullish, Bullish Turned
 Shareholding Snapshot : Mar 2026
Shareholding Compare (%holding)
Promoters
None
Held by 1 Schemes (0.07%)
Held by 2 FIIs (0.8%)
Rahul Jeetmal Parekh (17.3%)
None
26.49%
Quarterly Results Snapshot (Consolidated) - Mar'26 - QoQ

QoQ Growth in quarter ended Mar 2026 is 21.88% vs -0.28% in Dec 2025
QoQ Growth in quarter ended Mar 2026 is 303.95% vs 77.65% in Dec 2025
Half Yearly Results Snapshot (Consolidated) - Sep'25

Growth in half year ended Sep 2025 is -25.14% vs 18.03% in Sep 2024
Growth in half year ended Sep 2025 is -146.86% vs 194.59% in Sep 2024
Nine Monthly Results Snapshot (Consolidated) - Dec'25
YoY Growth in nine months ended Dec 2025 is -23.38% vs 3.05% in Dec 2024
YoY Growth in nine months ended Dec 2025 is -332.35% vs 144.74% in Dec 2024
Annual Results Snapshot (Consolidated) - Mar'26
YoY Growth in year ended Mar 2026 is -11.43% vs -8.36% in Mar 2025
YoY Growth in year ended Mar 2026 is -100.25% vs 457.04% in Mar 2025
About Mahalaxmi Fabric Mills Ltd

Company Coordinates


