
Compare Mahalaxmi Seam. with Similar Stocks
Stock DNA
Iron & Steel Products
INR 5 Cr (Micro Cap)
NA (Loss Making)
26
0.00%
-0.75
8.00%
-4.75
Total Returns (Price + Dividend) 
Latest dividend: 0.5000 per share ex-dividend date: Nov-27-2007
Risk Adjusted Returns v/s
Returns Beta

News
Are Mahalaxmi Seamless Ltd latest results good or bad?
The latest financial results for Mahalaxmi Seamless Ltd indicate significant operational challenges. In the quarter ending March 2026, the company reported net sales of ₹0.51 crores, reflecting a year-on-year growth of 13.33% and a quarter-on-quarter increase of 6.25%. However, this modest revenue growth was overshadowed by a substantial rise in employee costs, which surged by 257.89% year-on-year to ₹0.68 crores. This dramatic increase in personnel expenses led to an operating profit of negative ₹0.26 crores, marking the worst quarterly performance on record for the company. The operating margin plummeted to negative 50.98%, a stark contrast to the positive margin of 37.78% reported in the same quarter of the previous year. Additionally, the net profit for the quarter was a loss of ₹0.33 crores, a significant decline from a profit of ₹0.07 crores in the prior year. The company also reported a negative boo...
Read full news article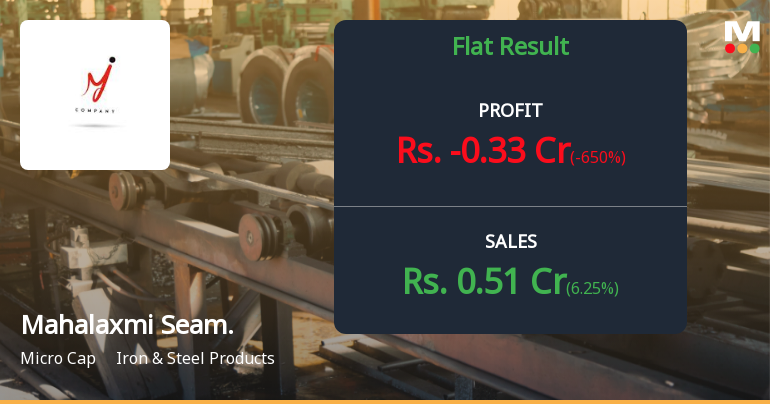
Mahalaxmi Seamless Q4 FY26: Sharp Losses Derail Recovery as Operational Crisis Deepens
Mahalaxmi Seamless Ltd., a micro-cap cold-drawn carbon steel pipe manufacturer, reported a dramatic reversal in Q4 FY26 (March quarter), plunging into losses of ₹0.33 crores compared to a profit of ₹0.07 crores in the year-ago period. The sharp deterioration in operational performance has sent the stock tumbling 3.72% to ₹7.51, extending its one-year decline to 20.61% and raising serious questions about the company's viability in an otherwise buoyant steel sector.
Read full news articleAre Mahalaxmi Seamless Ltd latest results good or bad?
Mahalaxmi Seamless Ltd's latest financial results for Q3 FY26 reveal a complex picture of operational challenges. The company reported net sales of ₹0.48 crores, reflecting a sequential growth of 6.67% from the previous quarter. However, this revenue growth is overshadowed by a significant decline in profitability metrics. The net profit fell to ₹0.06 crores, representing a 40.00% decrease compared to the prior quarter, while the operating margin contracted sharply to 31.25%, down 875 basis points from Q2 FY26. The financial data indicates that despite a slight increase in revenue, the company is grappling with severe margin compression and a negative operating profit, which has reached its lowest level in seven quarters. The operating profit margin has deteriorated to 31.25%, and the PAT margin has also declined to 12.50%. This trend highlights the company's struggle to maintain profitability amid rising ...
Read full news article Announcements
Board Meeting Outcome for Outcome Of Board Meeting- Proposed Off-Market Inter-Se Transfer By Way Of Gift Between Promoters Under Regulation 10(1)(A)(I) Of The SEBI (Substantial Acquisition Of Shares And Takeovers) Regulations 2011
02-Jul-2026 | Source : BSERespected Sir Pursuant to the provisions of Regulation 10(1)(a)(i) of the Securities and Exchange Board of India (Substantial Acquisition of Shares and Takeovers) Regulations 2011 as amended we hereby inform you that the Board of Directors of the Company at its meeting held on Thursday 02nd July 2026 which commenced at 4:00 P.M. and concluded at 4:30 P.M. at the Registered Office of the Company inter alia took note of and placed on record the proposed off-market inter-se transfer of equity shares by way of gift between the Promoters of the Company
Prior Intimation Of Off-Market Inter-Se Transfer Of Equity Shares Between Promoters In Accordance With Regulation 10(5) Of SEBI (Substantial Acquisition Of Shares And Takeovers) Regulations 2011
02-Jul-2026 | Source : BSEPrior Intimation of Off-market Inter-se transfer of equity shares between promoters in accordance with Regulation 10(5) of SEBI (Substantial Acquisition of Shares and Takeovers)regulations 2011.
Corporate Actions

No Upcoming Board Meetings

Mahalaxmi Seamless Ltd has declared 5% dividend, ex-date: 27 Nov 07

No Splits history available

No Bonus history available

No Rights history available
Quality key factors
Valuation key factors
Technicals key factors
 Technical Indicator Scale: Bearish, Mildly Bearish, Sideways, Mildly Bullish, Bullish Turned
 Shareholding Snapshot : Mar 2026
Shareholding Compare (%holding)
Non Institution
None
Held by 0 Schemes
Held by 0 FIIs
Sampathidevi Madhavprasad Jalan (16.43%)
Megh Sakariya International Private Limi (8.67%)
40.33%
Quarterly Results Snapshot (Standalone) - Mar'26 - QoQ

QoQ Growth in quarter ended Mar 2026 is 6.25% vs 6.67% in Dec 2025
QoQ Growth in quarter ended Mar 2026 is -650.00% vs -40.00% in Dec 2025
Half Yearly Results Snapshot (Standalone) - Sep'25
Growth in half year ended Sep 2025 is -4.26% vs 2.17% in Sep 2024
Growth in half year ended Sep 2025 is 35.71% vs 109.46% in Sep 2024
Nine Monthly Results Snapshot (Standalone) - Dec'25
YoY Growth in nine months ended Dec 2025 is -2.13% vs 2.17% in Dec 2024
YoY Growth in nine months ended Dec 2025 is 38.89% vs 112.41% in Dec 2024
Annual Results Snapshot (Standalone) - Mar'26

YoY Growth in year ended Mar 2026 is 1.61% vs 1.09% in Mar 2025
YoY Growth in year ended Mar 2026 is -128.00% vs 120.16% in Mar 2025
About Mahalaxmi Seamless Ltd

Company Coordinates


