
 Price Point
Compare Mahindra Holiday with Similar Stocks
ScoreDashboard
High Debt Company with a Debt to Equity ratio (avg) of 4.52 times
- Poor long term growth as Net Sales has grown by an annual rate of 10.84% over the last 5 years
- High Debt Company with a Debt to Equity ratio (avg) of 4.52 times
- The company has been able to generate a Return on Capital Employed (avg) of 6.14% signifying low profitability per unit of total capital (equity and debt)
With a fall in Net Sales of -10.66%, the company declared Very Negative results in Jun 26
Falling Participation by Institutional Investors
Consistent Underperformance against the benchmark over the last 3 years
Mojo ParametersStock DNA

Hotels & Resorts

INR 4,071 Cr (Small Cap)

75.00
36

0.00%

3.93

9.11%

5.23
Total ReturnsTotal Returns (Price + Dividend) 
Latest dividend: 2.666620879120879 per share ex-dividend date: Jul-25-2018
Risk Adjusted Returns v/s
Returns Beta
 News & Corporate Actions
News
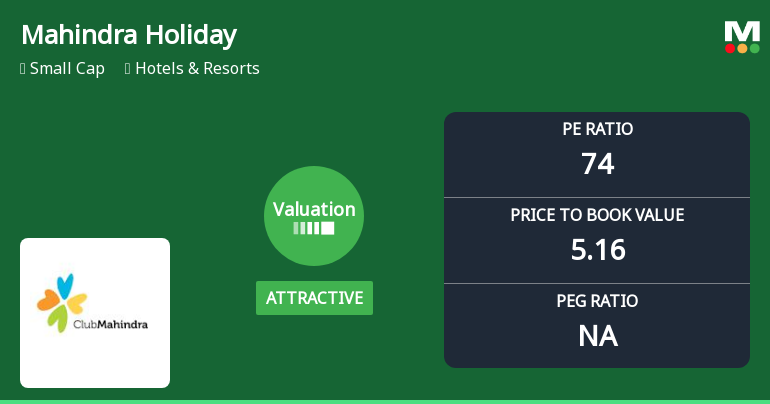
Mahindra Holidays & Resorts India Ltd Valuation Shifts Signal Price Attractiveness Amid Sector Challenges
Mahindra Holidays & Resorts India Ltd has recently witnessed a notable shift in its valuation parameters, moving from a fair to an attractive rating despite ongoing challenges in stock performance and returns. This article analyses the evolving price attractiveness of the company through key valuation metrics such as price-to-earnings (P/E) and price-to-book value (P/BV) ratios, comparing them with historical trends and peer averages within the Hotels & Resorts sector.
Read full news article
Mahindra Holidays & Resorts India Ltd is Rated Strong Sell
Mahindra Holidays & Resorts India Ltd is rated Strong Sell by MarketsMOJO. This rating was last updated on 14 July 2026, reflecting a reassessment of the company’s outlook. However, all fundamentals, returns, and financial metrics discussed below are current as of 19 September 2026, providing investors with the latest perspective on the stock’s performance and prospects.
Read full news article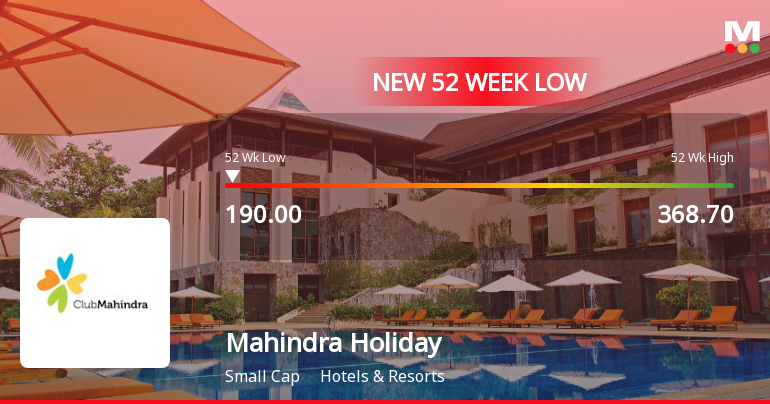
Five Consecutive Losses Push Mahindra Holidays & Resorts India Ltd to a New 52-Week Low
For the fifth straight session, Mahindra Holidays & Resorts India Ltd closed lower, breaching its 52-week low at Rs 190.5 on 16 Sep 2026, marking a 7.34% decline over this period amid persistent selling pressure.
Read full news article Announcements
Announcement under Regulation 30 (LODR)-Analyst / Investor Meet - Intimation
16-Sep-2026 | Source : BSEPlease refer the attached file.
Announcement under Regulation 30 (LODR)-Allotment of ESOP / ESPS
03-Sep-2026 | Source : BSEAllotment of shares pursuant to exercise of ESOPs.
Disclosure Under Regulation 30 Of SEBI (Listing Obligations And Disclosure Requirements) Regulations 2015
02-Sep-2026 | Source : BSEPlease refer the attached file.
Corporate Actions

No Upcoming Board Meetings

Mahindra Holidays & Resorts India Ltd has declared 40% dividend, ex-date: 25 Jul 18

No Splits history available

Mahindra Holidays & Resorts India Ltd has announced 1:2 bonus issue, ex-date: 08 Sep 21

No Rights history available
Key FactorsQuality key factors
Valuation key factors
Technicals key factors
 Technical Indicator Scale: Bearish, Mildly Bearish, Sideways, Mildly Bullish, Bullish Turned Shareholding
Shareholding Snapshot : Jun 2026
Shareholding Compare (%holding)
Promoters
None
Held by 5 Schemes (4.43%)
Held by 39 FIIs (4.01%)
Mahindra And Mahindra Limited (66.73%)
3p India Equity Fund 1 (4.21%)
14.84%
FinancialQuarterly Results Snapshot (Consolidated) - Jun'26 - QoQ
 Compare with Peers
QoQ Growth in quarter ended Jun 2026 is -10.66% vs 8.98% in Mar 2026
QoQ Growth in quarter ended Jun 2026 is -120.84% vs 1,763.68% in Mar 2026

Half Yearly Results Snapshot (Consolidated) - Sep'25

Growth in half year ended Sep 2025 is 7.19% vs 4.25% in Sep 2024
Growth in half year ended Sep 2025 is 30.81% vs -8.60% in Sep 2024
Nine Monthly Results Snapshot (Consolidated) - Dec'25
YoY Growth in nine months ended Dec 2025 is 8.46% vs 5.13% in Dec 2024
YoY Growth in nine months ended Dec 2025 is -48.71% vs 64.34% in Dec 2024
Annual Results Snapshot (Consolidated) - Mar'26
YoY Growth in year ended Mar 2026 is 7.58% vs 2.82% in Mar 2025
YoY Growth in year ended Mar 2026 is -45.52% vs 10.45% in Mar 2025
 Company CV
About Mahindra Holidays & Resorts India Ltd

Company Coordinates










