Mahindra Holiday

  • Market Cap: Small Cap
  • Industry: Hotels & Resorts
  • ISIN: INE998I01010
  • NSEID: MHRIL
  • BSEID: 533088
INR
218.15
1.65 (0.76%)
BSENSE

Jul 31, 03:30 PM

BSE+NSE Vol: 68.72 k

  • Price Points
  • Score
  • Mojo Parameters
  • Total Return
  • News and Corporate Actions
  • Key factors
  • Shareholding
  • Financials
  • CompanyCV
stock-summaryPrice Point
High/Low

1Day

52 Week

Valuation
Technical
Day's Volume

CASH

68.72 k (-55.98%) Volume

Shareholding (Jun 2026)

FII

4.01%

Held by 39 FIIs

DII

11.00%

Held by 7 DIIs

Promoter

66.73%

Why is Mahindra Holidays & Resorts India Ltd falling/rising?

01-Aug-2026

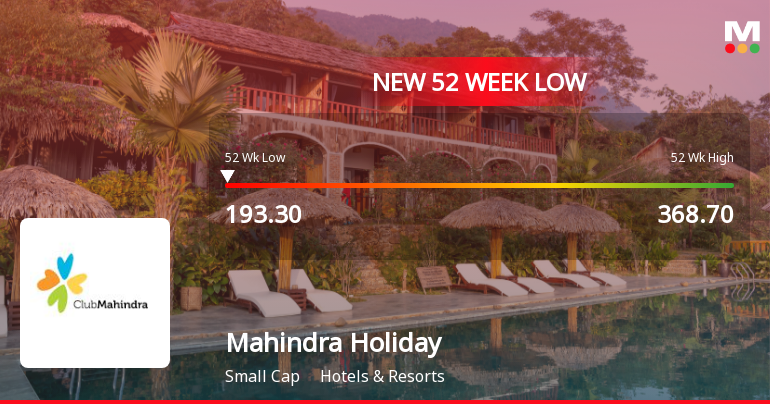
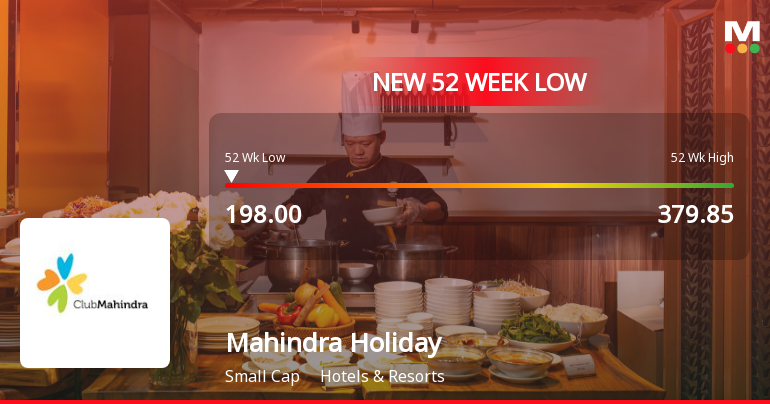
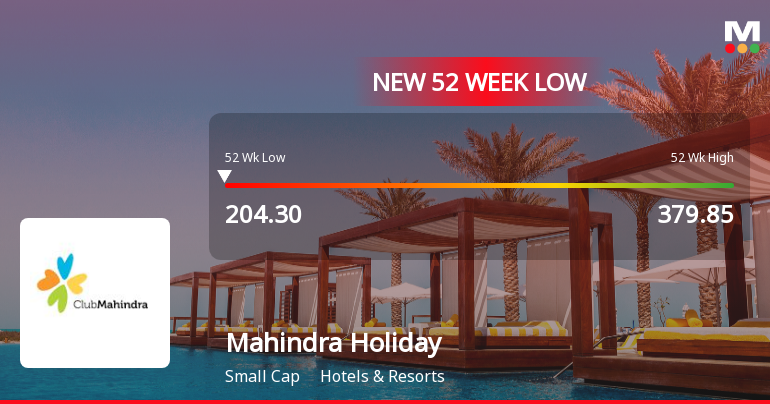
As of 31-Jul, Mahindra Holidays & Resorts India Ltd's stock price is currently at 218.15, reflecting a recent upward trend despite a year-to-date decline of 29.53%. Investor participation is decreasing, suggesting potential challenges for future price movements.

As of 31-Jul, Mahindra Holidays & Resorts India Ltd's stock price is rising, as indicated by a current price of 218.15, which reflects a change of 1.65 (0.76%) upward. This increase follows a trend where the stock has gained for the last two days, resulting in a total return of 1.84% during this period. Additionally, the stock has outperformed its sector by 2.27% today.<BR><BR>Despite this recent rise, it is important to note that the stock has experienced significant declines over longer periods, with a year-to-date drop of 29.53% and a one-year decline of 38.62%. The stock is currently 4.8% away from its 52-week low of Rs 208.4, indicating that it is still under pressure compared to its historical performance.<BR><BR>Investor participation appears to be declining, as evidenced by a delivery volume of 40.36 k on 30 July, which has decreased by 66.35% compared to the five-day average. This suggests that while the stock is experiencing a short-term rise, overall investor interest may be waning, which could impact future price movements. The stock is trading above its 5-day moving averages but remains below its longer-term moving averages, indicating mixed signals regarding its performance trajectory.

View full answer

Are Mahindra Holidays & Resorts India Ltd latest results good or bad?

23-Jul-2026

Mahindra Holidays & Resorts India Ltd's latest Q1 FY27 results are poor, showing a net loss of ₹8.66 crores, a significant decline from the previous profit of ₹41.56 crores, alongside deteriorating operating margins and rising costs, indicating operational challenges and financial strain.

Mahindra Holidays & Resorts India Ltd's latest results for Q1 FY27 indicate a challenging period for the company. The net loss of ₹8.66 crores marks a significant decline, with a staggering drop of 120.84% quarter-on-quarter and 210.04% year-on-year. This is a stark contrast to the previous quarter, where the company reported a profit of ₹41.56 crores.<BR><BR>Revenue for the quarter stood at ₹732.81 crores, reflecting a 10.66% decrease from the previous quarter, although it did show a modest year-on-year growth of 4.48%. However, the decline in revenue sequentially raises concerns about demand momentum.<BR><BR>Operating margins have also deteriorated sharply, falling to 15.39% from 24.04% in the previous quarter, indicating significant operational challenges. The company's financial health is further stressed by rising employee costs and interest expenses, which have contributed to a pre-tax loss.<BR><BR>Overall, the results highlight a period of operational difficulties and financial strain for Mahindra Holidays, suggesting that the latest performance can be characterized as poor. The company faces significant headwinds, including high leverage and declining profitability, which could impact its future outlook.

View full answer

Should I buy, sell or hold Mahindra Holidays & Resorts India Ltd?

23-Jul-2026

How big is Mahindra Holiday?

11-Jun-2026

As of 10th June, Mahindra Holidays & Resorts India Ltd has a market capitalization of 4,790.00 Cr, with recent net sales of 2,991.73 Cr and a net profit of 69.51 Cr over the last four quarters.

As of 10th June, <BR><BR>Market Cap: Mahindra Holidays & Resorts India Ltd has a market capitalization of 4,790.00 Cr, categorizing it as a Small Cap company.<BR><BR>Recent Quarterly Performance: The sum of Net Sales for the latest 4 quarters is 2,991.73 Cr, while the sum of Net Profit for the same period is 69.51 Cr.<BR><BR>Balance Sheet Snapshot: The reporting period for the balance sheet is March 2025. Shareholder's Funds stand at 780.45 Cr, and Total Assets are valued at 10,399.79 Cr.

View full answer

Who are in the management team of Mahindra Holiday?

11-Jun-2026

The management team of Mahindra Holiday includes Kavinder Singh (Managing Director & CEO), Dhanraj Mulki (Company Secretary), and several Non-Executive & Independent Directors such as Rohit Khattar, Sanjeev Aga, and Sangeeta Talwar, among others, bringing diverse expertise to the company.

The management team of Mahindra Holiday includes the following key members:<BR><BR>1. **Kavinder Singh** - Managing Director & CEO<BR>2. **Dhanraj Mulki** - Company Secretary & Compliance Officer<BR>3. **Rohit Khattar** - Non-Executive & Independent Director<BR>4. **Sanjeev Aga** - Non-Executive & Independent Director<BR>5. **Sangeeta Talwar** - Non-Executive & Independent Director<BR>6. **Anish Shah** - Non-Executive & Independent Director<BR>7. **Diwakar Gupta** - Non-Executive & Independent Director<BR>8. **Ruzbeh Baman Irani** - Non-Executive & Non-Independent Director<BR>9. **Rajat Jain** - Independent Director<BR>10. **C P Gurnani** - Director<BR><BR>This diverse board brings a range of expertise and experience to the company.

View full answer

Who are the peers of the Mahindra Holiday?

11-Jun-2026

Mahindra Holiday's peers include Chalet Hotels, Ventive Hospital, Leela Palaces, Lemon Tree Hotel, I T D C, Juniper Hotels, Samhi Hotels, Apeejay Surrend., Brigade Hotel, and TajGVK Hotels. It has an average management risk and growth, with a 1-year return of -36.50%, better than Juniper Hotels but worse than I T D C.

Peers: The peers of Mahindra Holiday are Chalet Hotels, Ventive Hospital, Leela Palaces Ho, Lemon Tree Hotel, I T D C, Juniper Hotels, Samhi Hotels, Apeejay Surrend., Brigade Hotel, and TajGVK Hotels.<BR><BR>Quality Snapshot: Below Average management risk is observed at Chalet Hotels, Ventive Hospital, Leela Palaces Ho, and Samhi Hotels, while Average management risk is found at Lemon Tree Hotel, I T D C, Mahindra Holiday, Juniper Hotels, Apeejay Surrend., Brigade Hotel, and TajGVK Hotels. Excellent growth is noted at Chalet Hotels and Ventive Hospital, while Good growth is seen at Mahindra Holiday and Samhi Hotels, Average growth is present at Leela Palaces Ho and I T D C, and Below Average growth is reported at Juniper Hotels, Apeejay Surrend., Brigade Hotel, and the rest. Below Average capital structure is noted at Chalet Hotels, Leela Palaces Ho, Lemon Tree Hotel, Mahindra Holiday, Juniper Hotels, Samhi Hotels, and Brigade Hotel, while Average capital structure is found at Ventive Hospital and I T D C, and Good capital structure is observed at Apeejay Surrend. and TajGVK Hotels.<BR><BR>Return Snapshot: The peer with the highest 1-year return is I T D C at -6.33%, while Juniper Hotels has the lowest at -39.24%, with Mahindra Holiday's own 1-year return at -36.50%, indicating it is better than Juniper Hotels but worse than I T D C. Additionally, peers with negative six-month returns include Chalet Hotels, Lemon Tree Hotel, Mahindra Holiday, Juniper Hotels, and Brigade Hotel.

View full answer

What does Mahindra Holiday do?

10-Jun-2026

Mahindra Holidays & Resorts India Ltd specializes in vacation ownership within the leisure hospitality industry, reporting net sales of 820 Cr and a net profit of 42 Cr for Q1 2026. The company has a market cap of INR 4,790 Cr and operates with a P/E ratio of 67.00.

Overview: <BR>Mahindra Holidays & Resorts India Ltd is a leading player in the leisure hospitality industry, specializing in vacation ownership, and operates within the small-cap market segment.<BR><BR>History: <BR>Mahindra Holidays & Resorts India Ltd was incorporated in 1996 and has established itself as a market leader in vacation ownership in India. The latest quarterly results reported net sales and net profit for the period ending March 2026.<BR><BR>Financial Snapshot: <BR>Most recent Net Sales: 820 Cr (Quarterly Results - Mar 2026) <BR>Most recent Net Profit: 42 Cr (Quarterly Results - Mar 2026) <BR>Market-cap value: INR 4,790 Cr (Small Cap)<BR><BR>Key Metrics: <BR>P/E: 67.00 <BR>Industry P/E: 35 <BR>Dividend Yield: 0.00% <BR>Debt-Equity: 3.93 <BR>Return on Equity: 9.11% <BR>Price to Book: 6.00<BR><BR>Contact Details: <BR>Address: Mahindra Towers 2nd Floor, No 17/18 Patullos Road Chennai Tamil Nadu : 600002 <BR>Phone: 91-44-39881000 <BR>Email: investors@mahindraholidays.com <BR>Website: http://www.clubmahindra.com

View full answer

Is Mahindra Holiday technically bullish or bearish?

28-Nov-2025

As of November 27, 2025, the technical outlook is bearish due to weak indicators like bearish MACD readings, Bollinger Bands, and moving averages, alongside significant underperformance compared to the Sensex.

As of 27 November 2025, the technical trend has changed from mildly bearish to bearish. The current technical stance is bearish with a strong indication of weakness. Key indicators driving this stance include bearish MACD readings on both the weekly and monthly time frames, bearish Bollinger Bands, and bearish moving averages on the daily chart. The KST is also bearish on both weekly and monthly time frames. The Dow Theory indicates a mildly bearish trend on the monthly, while the weekly shows no trend. Overall, the stock has underperformed significantly compared to the Sensex over various periods, further supporting the bearish outlook.

View full answer

How has been the historical performance of Mahindra Holiday?

27-Nov-2025

Mahindra Holiday has shown strong historical performance, with net sales increasing from 2,013.30 Cr in March 2022 to 2,780.85 Cr in March 2025, alongside significant improvements in profitability and operational efficiency. The company's earnings per share rose from -0.98 in March 2021 to 6.33 in March 2025, reflecting a positive turnaround.

Answer:<BR>The historical performance of Mahindra Holiday shows a positive trend in net sales and profitability over the past few years, culminating in the fiscal year ending March 2025.<BR><BR>Breakdown:<BR>Mahindra Holiday's net sales increased from 2,013.30 Cr in March 2022 to 2,780.85 Cr in March 2025, reflecting a steady growth trajectory. The total operating income followed a similar pattern, rising from 1,729.96 Cr in March 2021 to 2,780.85 Cr in March 2025. Operating profit (PBDIT) also saw significant improvement, climbing from 315.12 Cr in March 2022 to 707.78 Cr in March 2025, indicating enhanced operational efficiency. Profit before tax increased from 110.54 Cr in March 2022 to 193.62 Cr in March 2025, while profit after tax rose from 67.62 Cr to 127.04 Cr in the same period. The company's earnings per share (EPS) improved from -0.98 in March 2021 to 6.33 in March 2025, showcasing a turnaround in profitability. On the balance sheet, total assets grew from 8,356.46 Cr in March 2022 to 10,399.79 Cr in March 2025, while total liabilities increased from 8,013.96 Cr to 10,399.79 Cr, reflecting the company's expansion. Cash flow from operating activities remained strong, although there was a net cash outflow of 65.00 Cr in March 2025, down from a net inflow of 13.00 Cr in March 2023. Overall, Mahindra Holiday has demonstrated resilience and growth in its financial performance over the years.

View full answer

Is Mahindra Holiday overvalued or undervalued?

04-Nov-2025

As of November 3, 2025, Mahindra Holidays is considered undervalued with an attractive valuation grade, featuring a PE ratio of 49.75, lower than its peers like Indian Hotels Co and ITC Hotels, and showing potential for recovery with a 3-year return of 18.79%.

As of 3 November 2025, Mahindra Holiday's valuation grade has moved from fair to attractive, indicating a positive shift in its perceived value. The company is currently considered undervalued based on its financial metrics. Key ratios include a PE ratio of 49.75, an EV to EBITDA of 15.66, and a Price to Book Value of 0.91, which suggest that despite a high PE ratio, the overall valuation remains appealing compared to its peers.<BR><BR>In comparison to its industry peers, Mahindra Holiday's PE ratio is lower than that of Indian Hotels Co, which stands at 62.31, and ITC Hotels, which has a PE of 64.61. This positions Mahindra Holiday favorably within the sector, especially given its attractive valuation amidst a backdrop of overvalued competitors. While the stock has underperformed the Sensex over the past year, it has shown resilience with a 3-year return of 18.79%, reflecting potential for recovery and growth in the long term.

View full answer

Who are the top shareholders of the Mahindra Holiday?

06-Jun-2025

The top shareholders of Mahindra Holiday include Mahindra And Mahindra Ltd with 66.74%, HDFC Mutual Fund at 6.72%, mutual funds with a combined 8.09%, foreign institutional investors holding 5.36%, and individual investors owning 14.28%.

The top shareholders of Mahindra Holiday include Mahindra And Mahindra Ltd, which holds the largest stake at 66.74%. Other significant shareholders are HDFC Mutual Fund, specifically through the HDFC S&P BSE 500 ETF, with a holding of 6.72%. Additionally, the company has mutual funds represented by three schemes, collectively holding 8.09%, and foreign institutional investors (FIIs) holding 5.36% through 68 different entities. Individual investors also have a notable presence, owning 14.28% of the shares.

View full answer

When is the next results date for Mahindra Holiday?

06-Jun-2025

No Upcoming Board Meetings

What is the bonus history of the Mahindra Holiday?

06-Jun-2025

Mahindra Holidays & Resorts India Ltd has issued bonuses in a 1:2 ratio twice in recent years, with the latest occurring on September 8, 2021, and a previous one on July 10, 2017.

Mahindra Holidays & Resorts India Ltd has a history of bonus issues. The most recent bonus was a 1:2 issue, which was announced with an ex-date of September 8, 2021, and the record date was September 9, 2021. Prior to that, there was another 1:2 bonus issue on July 10, 2017, with a record date of July 11, 2017. This indicates that the company has issued bonuses in a 1:2 ratio on two occasions in recent years.

View full answer

Has Mahindra Holiday declared dividend?

06-Jun-2025

Yes, Mahindra Holidays & Resorts India Ltd has declared a dividend of 40% (₹4 per share) with an ex-date of July 25, 2018. However, the dividend yield is currently 0%, and total returns have varied, showing significant positive growth over longer periods, particularly a 108.99% return over five years.

Mahindra Holidays & Resorts India Ltd has declared a dividend.<BR><BR>Dividend Details:<BR>- Percentage announced: 40%<BR>- Amount per share: 4<BR>- Ex-date: 25 Jul 18<BR><BR>Dividend Yield: 0%<BR><BR>Total Returns by Period:<BR>In the 6-month period, the price return was -4.93%, the dividend return was 0%, resulting in a total return of -4.93%.<BR><BR>For the 1-year period, the price return was -9.7%, the dividend return was 0%, leading to a total return of -9.7%.<BR><BR>Over 2 years, the price return was 17.86%, with a dividend return of 0%, culminating in a total return of 17.86%.<BR><BR>In the 3-year period, the price return was 65.28%, the dividend return remained at 0%, resulting in a total return of 65.28%.<BR><BR>For the 4-year period, the price return was 37.97%, with a dividend return of 0%, leading to a total return of 37.97%.<BR><BR>Finally, in the 5-year period, the price return was 108.99%, while the dividend return was 0%, resulting in a total return of 108.99%.<BR><BR>Overall, Mahindra Holidays has declared a dividend, but the dividend yield is currently 0%. The total returns have varied significantly over the years, with notable positive returns over longer periods, particularly in the 5-year span.

View full answer
iScoreScore
Click here to find our call on this stock
Strong Sell
Sell
Hold
Buy
Strong Buy

Dashboard

1

High Debt Company with a Debt to Equity ratio (avg) of 4.52 times

  • Poor long term growth as Net Sales has grown by an annual rate of 10.84% over the last 5 years
  • High Debt Company with a Debt to Equity ratio (avg) of 4.52 times
  • The company has been able to generate a Return on Capital Employed (avg) of 6.14% signifying low profitability per unit of total capital (equity and debt)
2

With a fall in Net Sales of -10.66%, the company declared Very Negative results in Jun 26

3

Falling Participation by Institutional Investors

4

Consistent Underperformance against the benchmark over the last 3 years

stock-summaryMojo Parameters

Mojo Parameters

Loading Valuation Snapshot...

Stock DNA

stock-summary
Industry

Hotels & Resorts

stock-summary
Market cap

INR 4,383 Cr (Small Cap)

stock-summary
P/E

81.00

stock-summary
Industry P/E

38

stock-summary
Dividend Yield

0.00%

stock-summary
Debt Equity

3.93

stock-summary
Return on Equity

9.11%

stock-summary
Price to Book

5.63

Revenue and Profits:
Net Sales:
733 Cr
(Quarterly Results - Jun 2026)
Net Profit:
-9 Cr
stock-summaryTotal Returns
Total Returns (Price + Dividend) stock-summary
Dividend Yield (0%)
TimePeriod
Price Return
Dividend Return
Total Return
3 Months
-11.54%
0%
-11.54%
6 Months
-26.31%
0%
-26.31%
1 Year
-38.62%
0%
-38.62%
2 Years
-52.23%
0%
-52.23%
3 Years
-35.53%
0%
-35.53%
4 Years
-6.89%
0%
-6.89%
5 Years
-29.56%
0%
-29.56%

Latest dividend: 4 per share ex-dividend date: Jul-25-2018

Risk Adjusted Returns v/s stock-summary
Returns Beta
Icon
Beta has not been calculated since enough price history is not available
stock-summaryNews & Corporate Actions

Announcements stock-summary

Intimation Under Regulation 30 Of The Securities And Exchange Board Of India (Listing Obligations And Disclosure Requirements) Regulations 2015 - ESG Rating From ESG Risk Assessments & Insights Limited

28-Jul-2026 | Source : BSE

Please refer the attached file.

Announcement under Regulation 30 (LODR)-Earnings Call Transcript

28-Jul-2026 | Source : BSE

Please refer the attached file.

Announcement under Regulation 30 (LODR)-Analyst / Investor Meet - Outcome

23-Jul-2026 | Source : BSE

Please refer the attached file.

Corporate Actions stock-summary

stock-summary
BOARD MEETING

No Upcoming Board Meetings

stock-summary
DIVIDEND

Mahindra Holidays & Resorts India Ltd has declared 40% dividend, ex-date: 25 Jul 18

stock-summary
SPLITS

No Splits history available

stock-summary
BONUS

Mahindra Holidays & Resorts India Ltd has announced 1:2 bonus issue, ex-date: 08 Sep 21

stock-summary
RIGHTS

No Rights history available

stock-summaryKey Factors

Quality key factors stock-summary

Factor
Value
Sales Growth (5y)
10.84%
EBIT Growth (5y)
55.28%
EBIT to Interest (avg)
1.25
Debt to EBITDA (avg)
5.34
Net Debt to Equity (avg)
3.93
Sales to Capital Employed (avg)
0.96
Tax Ratio
53.02%
Dividend Payout Ratio
0
Pledged Shares
0
Institutional Holding
15.01%
ROCE (avg)
6.99%
ROE (avg)
21.20%

Valuation key factors

Factor
Value
P/E Ratio
81
Industry P/E
38
Price to Book Value
5.69
EV to EBIT
40.70
EV to EBITDA
12.33
EV to Capital Employed
1.95
EV to Sales
2.48
PEG Ratio
NA
Dividend Yield
NA
ROCE (Latest)
5.40%
ROE (Latest)
9.11%

Technicals key factors

Indicator
Weekly
Monthly
MACD
Mildly Bullish
Bearish
RSI
Bearish
No Signal
Bollinger Bands
Bearish
Bearish
Moving Averages
Bearish (Daily)
KST
Mildly Bullish
Bearish
Dow Theory
No Trend
No Trend
OBV
No Trend
No Trend
stock-summary Technical Indicator Scale: Bearish, Mildly Bearish, Sideways, Mildly Bullish, Bullish  Turned 
stock-summaryShareholding
Shareholding Snapshot : Jun 2026stock-summary
Shareholding Compare (%holding) stock-summary
Majority shareholders

Promoters

Pledged Promoter Holdings

None

Mutual Funds

Held by 5 Schemes (4.43%)

FIIs

Held by 39 FIIs (4.01%)

Promoter with highest holding

Mahindra And Mahindra Limited (66.73%)

Highest Public shareholder

3p India Equity Fund 1 (4.21%)

Individual Investors Holdings

14.84%

stock-summaryFinancial
[
  {
    "link": "quarterly",
    "btn_text": "All Quarterly Results",
    "header": "Quarterly Results Snapshot (Consolidated) - Jun'26 - QoQ",
    "rhs": [
      {
        "prefix": "Net Sales ",
        "suffix": "QoQ Growth in quarter ended Jun 2026 is -10.66% vs 8.98% in Mar 2026",
        "dir": -1
      },
      {
        "prefix": "Consolidated Net Profit ",
        "suffix": "QoQ Growth in quarter ended Jun 2026 is -120.84% vs 1,763.68% in Mar 2026",
        "dir": -1
      }
    ],
    "table": {
      "header": [
        "Jun'26",
        "Mar'26",
        "Change(%)"
      ],
      "body": [
        {
          "field": "Net Sales",
          "val1": "732.81",
          "val2": "820.29",
          "chgp": "-10.66%",
          "chgp_class": "negative"
        },
        {
          "field": "Operating Profit (PBDIT) excl Other Income",
          "val1": "112.80",
          "val2": "197.22",
          "chgp": "-42.80%",
          "chgp_class": "negative"
        },
        {
          "field": "Interest",
          "val1": "47.07",
          "val2": "46.95",
          "chgp": "0.26%",
          "chgp_class": "negative"
        },
        {
          "field": "Exceptional Items",
          "val1": "0.00",
          "val2": "0.00",
          "chgp": "",
          "chgp_class": "neutral"
        },
        {
          "field": "Consolidate Net Profit",
          "val1": "-8.66",
          "val2": "41.56",
          "chgp": "-120.84%",
          "chgp_class": "negative"
        },
        {
          "field": "Operating Profit Margin (Excl OI)",
          "val1": "15.39%",
          "val2": "24.04%",
          "chgp": "-8.65%",
          "chgp_class": "negative"
        }
      ]
    }
  },
  {
    "link": "half-yearly",
    "btn_text": "All Half Yearly Results",
    "header": "Half Yearly Results Snapshot (Consolidated) - Sep'25",
    "rhs": [
      {
        "prefix": "Net Sales ",
        "suffix": " Growth in half year ended Sep 2025 is 7.19% vs 4.25% in Sep 2024",
        "dir": 1
      },
      {
        "prefix": "Consolidated Net Profit ",
        "suffix": " Growth in half year ended Sep 2025 is 30.81% vs -8.60% in Sep 2024",
        "dir": 1
      }
    ],
    "table": {
      "header": [
        "Sep'25",
        "Sep'24",
        "Change(%)"
      ],
      "body": [
        {
          "field": "Net Sales",
          "val1": "1,418.75",
          "val2": "1,323.60",
          "chgp": "7.19%",
          "chgp_class": "positive"
        },
        {
          "field": "Operating Profit (PBDIT) excl Other Income",
          "val1": "275.20",
          "val2": "228.77",
          "chgp": "20.30%",
          "chgp_class": "positive"
        },
        {
          "field": "Interest",
          "val1": "86.86",
          "val2": "72.83",
          "chgp": "19.26%",
          "chgp_class": "negative"
        },
        {
          "field": "Exceptional Items",
          "val1": "0.00",
          "val2": "0.00",
          "chgp": "",
          "chgp_class": "neutral"
        },
        {
          "field": "Consolidate Net Profit",
          "val1": "25.73",
          "val2": "19.67",
          "chgp": "30.81%",
          "chgp_class": "positive"
        },
        {
          "field": "Operating Profit Margin (Excl OI)",
          "val1": "19.40%",
          "val2": "17.28%",
          "chgp": "2.12%",
          "chgp_class": "positive"
        }
      ]
    }
  },
  {
    "link": "nine-monthly",
    "btn_text": "All Nine Monthly Results",
    "header": "Nine Monthly Results Snapshot (Consolidated) - Dec'25",
    "rhs": [
      {
        "prefix": "Net Sales ",
        "suffix": "YoY Growth in nine months ended Dec 2025 is 8.46% vs 5.13% in Dec 2024",
        "dir": 1
      },
      {
        "prefix": "Consolidated Net Profit ",
        "suffix": "YoY Growth in nine months ended Dec 2025 is -48.71% vs 64.34% in Dec 2024",
        "dir": -1
      }
    ],
    "table": {
      "header": [
        "Dec'25",
        "Dec'24",
        "Change(%)"
      ],
      "body": [
        {
          "field": "Net Sales",
          "val1": "2,171.45",
          "val2": "2,002.03",
          "chgp": "8.46%",
          "chgp_class": "positive"
        },
        {
          "field": "Operating Profit (PBDIT) excl Other Income",
          "val1": "419.37",
          "val2": "374.46",
          "chgp": "11.99%",
          "chgp_class": "positive"
        },
        {
          "field": "Interest",
          "val1": "134.10",
          "val2": "109.79",
          "chgp": "22.14%",
          "chgp_class": "negative"
        },
        {
          "field": "Exceptional Items",
          "val1": "-11.06",
          "val2": "0.00",
          "chgp": "",
          "chgp_class": "neutral"
        },
        {
          "field": "Consolidate Net Profit",
          "val1": "27.96",
          "val2": "54.51",
          "chgp": "-48.71%",
          "chgp_class": "negative"
        },
        {
          "field": "Operating Profit Margin (Excl OI)",
          "val1": "19.31%",
          "val2": "18.70%",
          "chgp": "0.61%",
          "chgp_class": "positive"
        }
      ]
    }
  },
  {
    "link": "annual",
    "btn_text": "All Annual Results",
    "header": "Annual Results Snapshot (Consolidated) - Mar'26",
    "rhs": [
      {
        "prefix": "Net Sales ",
        "suffix": "YoY Growth in year ended Mar 2026 is 7.58% vs 2.82% in Mar 2025",
        "dir": 1
      },
      {
        "prefix": "Consolidated Net Profit ",
        "suffix": "YoY Growth in year ended Mar 2026 is -45.52% vs 10.45% in Mar 2025",
        "dir": -1
      }
    ],
    "table": {
      "header": [
        "Mar'26",
        "Mar'25",
        "Change(%)"
      ],
      "body": [
        {
          "field": "Net Sales",
          "val1": "2,991.74",
          "val2": "2,780.85",
          "chgp": "7.58%",
          "chgp_class": "positive"
        },
        {
          "field": "Operating Profit (PBDIT) excl Other Income",
          "val1": "616.60",
          "val2": "578.82",
          "chgp": "6.53%",
          "chgp_class": "positive"
        },
        {
          "field": "Interest",
          "val1": "181.05",
          "val2": "148.17",
          "chgp": "22.19%",
          "chgp_class": "negative"
        },
        {
          "field": "Exceptional Items",
          "val1": "-11.06",
          "val2": "0.00",
          "chgp": "",
          "chgp_class": "neutral"
        },
        {
          "field": "Consolidate Net Profit",
          "val1": "69.51",
          "val2": "127.59",
          "chgp": "-45.52%",
          "chgp_class": "negative"
        },
        {
          "field": "Operating Profit Margin (Excl OI)",
          "val1": "20.61%",
          "val2": "20.81%",
          "chgp": "-0.20%",
          "chgp_class": "negative"
        }
      ]
    }
  }
]

Quarterly Results Snapshot (Consolidated) - Jun'26 - QoQstock-summary

Jun'26
Mar'26
Change(%)
Net Sales
732.81
820.29
-10.66%
Operating Profit (PBDIT) excl Other Income
112.80
197.22
-42.80%
Interest
47.07
46.95
0.26%
Exceptional Items
0.00
0.00
Consolidate Net Profit
-8.66
41.56
-120.84%
Operating Profit Margin (Excl OI)
15.39%
24.04%
-8.65%
Values in Rs Cr.
Direction Arrows
Net Sales

QoQ Growth in quarter ended Jun 2026 is -10.66% vs 8.98% in Mar 2026

Direction Arrows
Consolidated Net Profit

QoQ Growth in quarter ended Jun 2026 is -120.84% vs 1,763.68% in Mar 2026

Half Yearly Results Snapshot (Consolidated) - Sep'25stock-summary

Sep'25
Sep'24
Change(%)
Net Sales
1,418.75
1,323.60
7.19%
Operating Profit (PBDIT) excl Other Income
275.20
228.77
20.30%
Interest
86.86
72.83
19.26%
Exceptional Items
0.00
0.00
Consolidate Net Profit
25.73
19.67
30.81%
Operating Profit Margin (Excl OI)
19.40%
17.28%
2.12%
Values in Rs Cr.
Direction Arrows
Net Sales

Growth in half year ended Sep 2025 is 7.19% vs 4.25% in Sep 2024

Direction Arrows
Consolidated Net Profit

Growth in half year ended Sep 2025 is 30.81% vs -8.60% in Sep 2024

Nine Monthly Results Snapshot (Consolidated) - Dec'25stock-summary

Dec'25
Dec'24
Change(%)
Net Sales
2,171.45
2,002.03
8.46%
Operating Profit (PBDIT) excl Other Income
419.37
374.46
11.99%
Interest
134.10
109.79
22.14%
Exceptional Items
-11.06
0.00
Consolidate Net Profit
27.96
54.51
-48.71%
Operating Profit Margin (Excl OI)
19.31%
18.70%
0.61%
Values in Rs Cr.
Direction Arrows
Net Sales

YoY Growth in nine months ended Dec 2025 is 8.46% vs 5.13% in Dec 2024

Direction Arrows
Consolidated Net Profit

YoY Growth in nine months ended Dec 2025 is -48.71% vs 64.34% in Dec 2024

Annual Results Snapshot (Consolidated) - Mar'26stock-summary

Mar'26
Mar'25
Change(%)
Net Sales
2,991.74
2,780.85
7.58%
Operating Profit (PBDIT) excl Other Income
616.60
578.82
6.53%
Interest
181.05
148.17
22.19%
Exceptional Items
-11.06
0.00
Consolidate Net Profit
69.51
127.59
-45.52%
Operating Profit Margin (Excl OI)
20.61%
20.81%
-0.20%
Values in Rs Cr.
Direction Arrows
Net Sales

YoY Growth in year ended Mar 2026 is 7.58% vs 2.82% in Mar 2025

Direction Arrows
Consolidated Net Profit

YoY Growth in year ended Mar 2026 is -45.52% vs 10.45% in Mar 2025

stock-summaryCompany CV
About Mahindra Holidays & Resorts India Ltd stock-summary
stock-summary
Mahindra Holidays & Resorts India Ltd
Small Cap
Hotels & Resorts
Mahindra Holidays & Resorts India Limited was incorporated on September 20, 1996 as a Private Limited company with the name Mahindra Holidays & Resorts India Private Limited. In January, 1998, the company was converted into Public Limited Company and the name was changed to Mahindra Holidays & Resorts India Limited. At present, the Company is engaged in the business of selling vacation ownership and providing holiday facilities.
Company Coordinates stock-summary
Company Details
Mahindra Towers 2nd Floor, No 17/18 Patullos Road Chennai Tamil Nadu : 600002
stock-summary
Tel: 91-44-39881000
stock-summary
investors@mahindraholidays.com
Registrar Details
Karvy Computershare Pvt Ltd, Plot No 17-24 , Near Image Hospital,, Reliance Cybervilae,Vithalrao Nagar,, Madhapur, Hyderabad