
Compare Maitri Enterp. with Similar Stocks
Dashboard
Weak Long Term Fundamental Strength with an average Return on Capital Employed (ROCE) of 9.07%
- Low ability to service debt as the company has a high Debt to EBITDA ratio of 3.72 times
Positive results in Mar 26
With ROCE of 12.7, it has a Fair valuation with a 2.3 Enterprise value to Capital Employed
Majority shareholders : Promoters
Market Beating performance in long term as well as near term
Stock DNA
Non - Ferrous Metals
INR 18 Cr (Micro Cap)
29.00
13
0.00%
0.82
11.41%
3.34
Total Returns (Price + Dividend) 
Maitri Enterp. for the last several years.
Risk Adjusted Returns v/s
Returns Beta

News
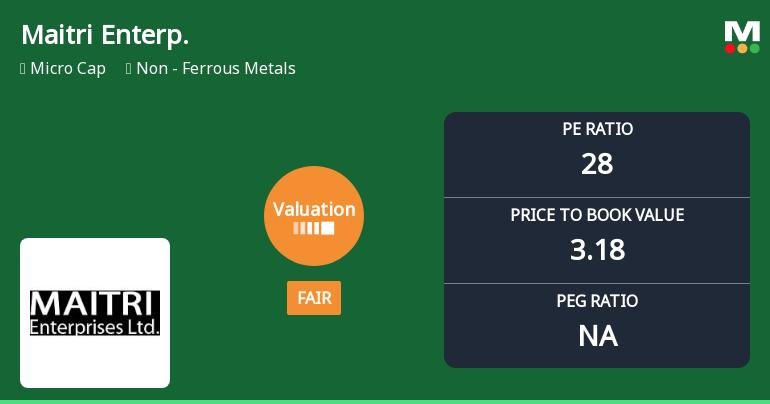
Maitri Enterprises Ltd Valuation Shifts: From Attractive to Fair Amid Market Volatility
Maitri Enterprises Ltd, a micro-cap player in the Non - Ferrous Metals sector, has seen its valuation grade shift from attractive to fair, reflecting evolving market perceptions and sector-specific challenges. Despite a robust share price performance year-to-date, the company’s price-to-earnings (P/E) and price-to-book value (P/BV) ratios now align more closely with peers, signalling a recalibration of price attractiveness amid broader industry trends.
Read full news article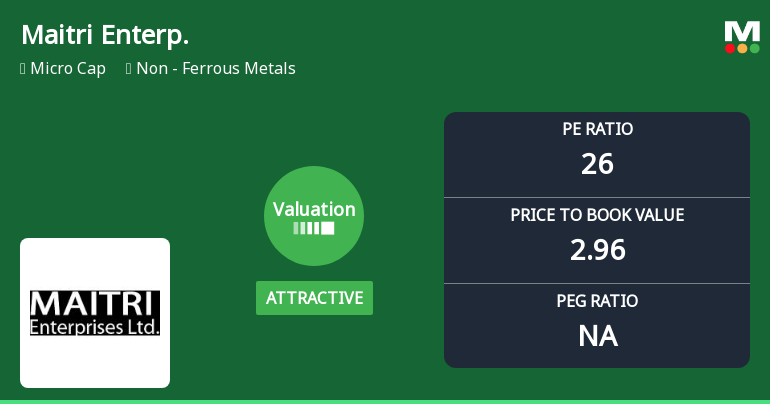
Maitri Enterprises Ltd Valuation Shifts Signal Renewed Price Attractiveness
Maitri Enterprises Ltd, a micro-cap player in the Non-Ferrous Metals sector, has seen its valuation parameters shift favourably, moving from a fair to an attractive rating. Despite a recent dip in share price, the company’s price-to-earnings (P/E) and price-to-book value (P/BV) ratios now present a compelling case for investors seeking value in a sector marked by volatility and mixed returns.
Read full news article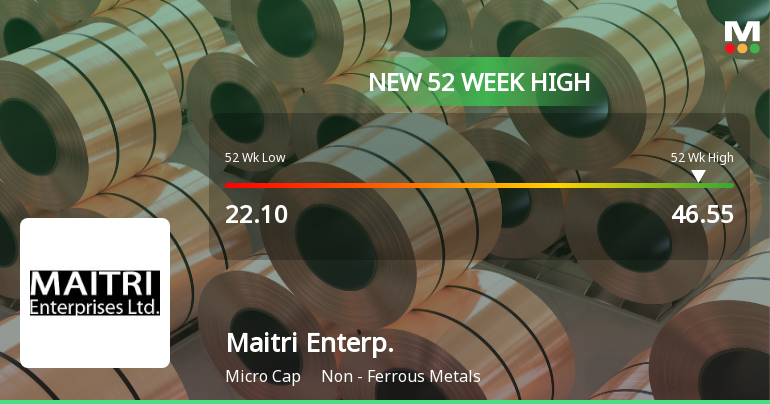
Broad-Based Technical Strength Lifts Maitri Enterprises Ltd to 52-Week High of Rs 46.55
Surging to a fresh 52-week high of Rs 46.55 on 29 Jun 2026, Maitri Enterprises Ltd has demonstrated robust price momentum, outperforming its sector and the broader market. This milestone caps a 24.94% gain over the past year, significantly outpacing the Sensex’s decline of 8.23% during the same period.
Read full news article Announcements
Compliances-Certificate under Reg. 74 (5) of SEBI (DP) Regulations 2018
16-Jul-2026 | Source : BSECertificate under regulation 74(5) of the SEBI (Depositories and Participants) Regulation 2018 for the Quarter ended June 30 2026.
Closure of Trading Window
29-Jun-2026 | Source : BSEIntimation for Closure of Trading Window
Announcement under Regulation 30 (LODR)-Newspaper Publication
30-May-2026 | Source : BSENewspaper Advertisement for an Audited Standalone & Consolidated Financial Result for the Quarter and Year Ended on March 31 2026.
Corporate Actions

No Upcoming Board Meetings

No Dividend history available

No Splits history available

No Bonus history available

No Rights history available
Quality key factors
Valuation key factors
Technicals key factors
 Technical Indicator Scale: Bearish, Mildly Bearish, Sideways, Mildly Bullish, Bullish Turned
 Shareholding Snapshot : Mar 2026
Shareholding Compare (%holding)
Promoters
None
Held by 0 Schemes
Held by 0 FIIs
Chanderlal Bulchand Ambwani (17.59%)
Puspak Fin Stock Pvt Ltd (3.65%)
32.23%
Quarterly Results Snapshot (Consolidated) - Mar'26 - QoQ

QoQ Growth in quarter ended Mar 2026 is 198.50% vs -39.95% in Dec 2025
QoQ Growth in quarter ended Mar 2026 is 11.90% vs 2.44% in Dec 2025
Half Yearly Results Snapshot (Consolidated) - Sep'25

Growth in half year ended Sep 2025 is -2.19% vs 142.12% in Sep 2024
Growth in half year ended Sep 2025 is -150.00% vs 93.33% in Sep 2024
Nine Monthly Results Snapshot (Consolidated) - Dec'25
YoY Growth in nine months ended Dec 2025 is -14.84% vs 144.05% in Dec 2024
YoY Growth in nine months ended Dec 2025 is -31.58% vs 5.56% in Dec 2024
Annual Results Snapshot (Consolidated) - Mar'26
YoY Growth in year ended Mar 2026 is 16.19% vs 50.76% in Mar 2025
YoY Growth in year ended Mar 2026 is 252.94% vs 137.78% in Mar 2025
About Maitri Enterprises Ltd

Company Coordinates


