
Compare Majestic Auto with Similar Stocks
Dashboard
With a Operating Losses, the company has a Weak Long Term Fundamental Strength
- Company's ability to service its debt is weak with a poor EBIT to Interest (avg) ratio of 1.31
- The company has been able to generate a Return on Equity (avg) of 3.30% signifying low profitability per unit of shareholders funds
Flat results in Mar 26
Risky - Negative Operating Profits
Stock DNA
Diversified Commercial Services
INR 348 Cr (Micro Cap)
15.00
41
11.94%
-0.69
3.55%
0.52
Total Returns (Price + Dividend) 
Latest dividend: 35 per share ex-dividend date: Feb-17-2026
Risk Adjusted Returns v/s
Returns Beta

News

Majestic Auto Ltd is Rated Strong Sell
Majestic Auto Ltd is rated Strong Sell by MarketsMOJO, with this rating last updated on 20 Feb 2026. However, the analysis and financial metrics discussed below reflect the company’s current position as of 03 June 2026, providing investors with an up-to-date view of the stock’s fundamentals, valuation, financial trends, and technical outlook.
Read full news article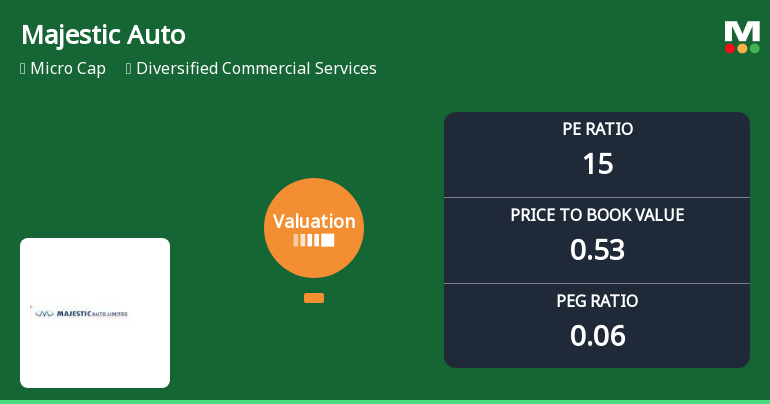
Majestic Auto Ltd Valuation Shifts Signal Elevated Risk Amid Mixed Returns
Majestic Auto Ltd, a micro-cap player in the Diversified Commercial Services sector, has seen a marked shift in its valuation parameters, moving from a previously expensive rating to a risky classification. This change reflects significant concerns over its price-to-earnings (P/E) and price-to-book value (P/BV) ratios relative to historical levels and peer benchmarks, raising questions about the stock’s price attractiveness despite recent gains.
Read full news articleAre Majestic Auto Ltd latest results good or bad?
Majestic Auto Ltd's latest financial results for Q4 FY26 indicate significant operational challenges. The company reported net sales of ₹3.47 crores, reflecting a substantial decline of 76.66% year-on-year, marking a continuation of a downward trend in revenue generation. This decline is particularly concerning as it follows a previous quarter's revenue of ₹3.40 crores, indicating a persistent struggle to maintain sales above ₹4 crores, a threshold the company has not surpassed for two consecutive quarters. The net loss for the quarter stood at ₹2.63 crores, which represents a notable deterioration compared to prior periods, highlighting the company's ongoing difficulties in achieving profitability. The operating margin, excluding other income, was recorded at -126.80%, indicating that the company is facing severe operational inefficiencies. This marks the worst quarterly performance on record, with operat...
Read full news article Announcements
Announcement under Regulation 30 (LODR)-Newspaper Publication
04-Jun-2026 | Source : BSEIntimation of Newspaper publication w.r.t Opening of Special Window for Transfer and Dematerialisation Request of Physical Shares.
Compliances-Reg.24(A)-Annual Secretarial Compliance
28-May-2026 | Source : BSEAnnual Secretarial Compliance Report for the Financial Year ended on March 31 2026.
Announcement under Regulation 30 (LODR)-Newspaper Publication
25-May-2026 | Source : BSEDetails as per attachment enclosed
Corporate Actions

No Upcoming Board Meetings

Majestic Auto Ltd has declared 350% dividend, ex-date: 17 Feb 26

No Splits history available

No Bonus history available

No Rights history available
Quality key factors
Valuation key factors
Technicals key factors
 Technical Indicator Scale: Bearish, Mildly Bearish, Sideways, Mildly Bullish, Bullish Turned
 Shareholding Snapshot : Mar 2026
Shareholding Compare (%holding)
Promoters
None
Held by 2 Schemes (0.03%)
Held by 5 FIIs (0.02%)
Anadi Investments Pvt Ltd (74.61%)
Dipak Kanayalal Shah (3.27%)
22.16%
Quarterly Results Snapshot (Consolidated) - Mar'26 - YoY

YoY Growth in quarter ended Mar 2026 is -76.66% vs -4.19% in Mar 2025

YoY Growth in quarter ended Mar 2026 is 66.06% vs -1,170.49% in Mar 2025
Half Yearly Results Snapshot (Consolidated) - Sep'25
Growth in half year ended Sep 2025 is -11.46% vs -39.15% in Sep 2024
Growth in half year ended Sep 2025 is 405.58% vs -30.58% in Sep 2024
Nine Monthly Results Snapshot (Consolidated) - Dec'25
YoY Growth in nine months ended Dec 2025 is -35.45% vs -27.17% in Dec 2024
YoY Growth in nine months ended Dec 2025 is 547.97% vs -55.40% in Dec 2024
Annual Results Snapshot (Consolidated) - Mar'26
YoY Growth in year ended Mar 2026 is -44.97% vs -22.91% in Mar 2025
YoY Growth in year ended Mar 2026 is 1,245.81% vs -78.73% in Mar 2025
About Majestic Auto Ltd

Company Coordinates


