
Compare Makers Labs. with Similar Stocks
Stock DNA
Pharmaceuticals & Biotechnology
INR 91 Cr (Micro Cap)
39.00
27
0.00%
-0.08
3.22%
1.25
Total Returns (Price + Dividend) 
Latest dividend: 1 per share ex-dividend date: Aug-01-2019
Risk Adjusted Returns v/s
Returns Beta

News
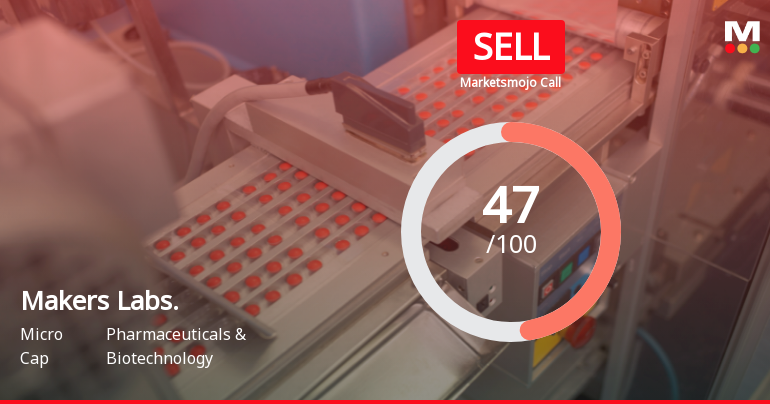
Makers Laboratories Ltd Downgraded to Sell Amid Valuation and Financial Concerns
Makers Laboratories Ltd, a micro-cap player in the Pharmaceuticals & Biotechnology sector, has seen its investment rating downgraded from Hold to Sell by MarketsMOJO as of 27 July 2026. The revision primarily stems from a deterioration in valuation metrics, despite some positive quarterly financial trends and technical signals. This article analyses the four key parameters—Quality, Valuation, Financial Trend, and Technicals—that influenced the change in the company’s Mojo Grade to 47.0, signalling a Sell recommendation.
Read full news article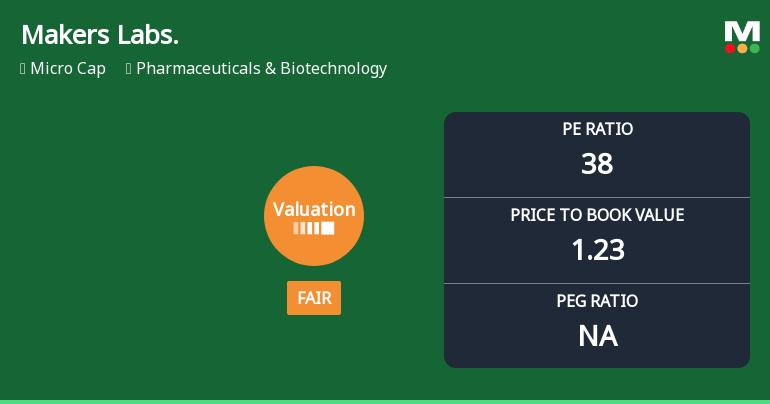
Makers Laboratories Ltd Valuation Shifts: From Attractive to Fair Amidst Sector Dynamics
Makers Laboratories Ltd, a micro-cap player in the Pharmaceuticals & Biotechnology sector, has seen a notable shift in its valuation parameters, moving from an attractive to a fair rating. This change reflects evolving market perceptions amid rising price-to-earnings (P/E) and price-to-book value (P/BV) ratios, positioning the stock differently against its peers and historical benchmarks.
Read full news article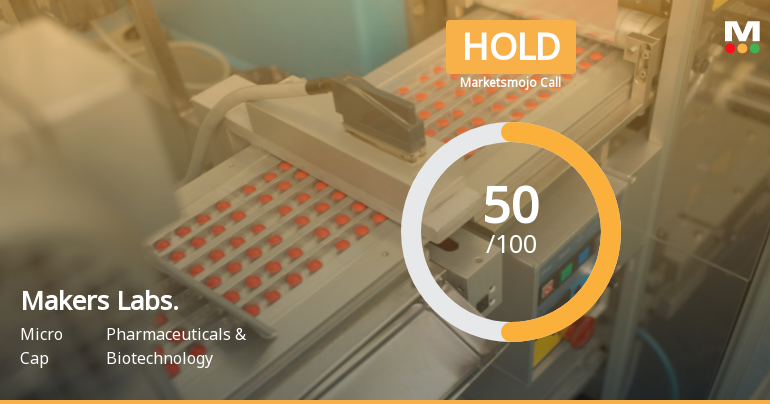
Makers Laboratories Ltd Upgraded to Hold on Improved Valuation and Financial Trends
Makers Laboratories Ltd has seen its investment rating upgraded from Sell to Hold, driven primarily by an improved valuation profile and encouraging quarterly financial results. The micro-cap pharmaceutical company’s Mojo Score has risen to 50.0, reflecting a more balanced outlook amid mixed long-term fundamentals and recent operational progress.
Read full news article Announcements
Board Meeting Intimation for Standalone And Consolidated Unaudited Financial Results For The 1St Quarter Ended June 30 2026
23-Jul-2026 | Source : BSEMakers Laboratories Ltd-has informed BSE that the meeting of the Board of Directors of the Company is scheduled on 07/08/2026 inter alia to consider and approve Standalone and Consolidated Unaudited Financial Results for the 1st quarter ended June 30 2026
Intimation To Shareholders Regarding Weblink Of Annual Report
13-Jul-2026 | Source : BSEIntimation to shareholders regarding weblink of Annual Report
Announcement under Regulation 30 (LODR)-Newspaper Publication
13-Jul-2026 | Source : BSECopy of Newspaper Publication
Corporate Actions

07 Aug 2026

Makers Laboratories Ltd has declared 10% dividend, ex-date: 01 Aug 19

No Splits history available

No Bonus history available

Makers Laboratories Ltd has announced 1:5 rights issue, ex-date: 30 Mar 22
Quality key factors
Valuation key factors
Technicals key factors
 Technical Indicator Scale: Bearish, Mildly Bearish, Sideways, Mildly Bullish, Bullish Turned
 Shareholding Snapshot : Jun 2026
Shareholding Compare (%holding)
Promoters
None
Held by 0 Schemes
Held by 0 FIIs
Kaygee Investments Private Limited (36.88%)
Tanvi Jignesh Mehta (2.21%)
31.72%
Quarterly Results Snapshot (Consolidated) - Mar'26 - QoQ

QoQ Growth in quarter ended Mar 2026 is 0.22% vs 4.39% in Dec 2025
QoQ Growth in quarter ended Mar 2026 is 15.96% vs 883.33% in Dec 2025
Half Yearly Results Snapshot (Consolidated) - Sep'25
Growth in half year ended Sep 2025 is 16.94% vs 18.15% in Sep 2024
Growth in half year ended Sep 2025 is -95.91% vs 327.62% in Sep 2024
Nine Monthly Results Snapshot (Consolidated) - Dec'25

YoY Growth in nine months ended Dec 2025 is 20.73% vs 13.41% in Dec 2024
YoY Growth in nine months ended Dec 2025 is -83.27% vs 251.20% in Dec 2024
Annual Results Snapshot (Consolidated) - Mar'26
YoY Growth in year ended Mar 2026 is 16.43% vs 15.67% in Mar 2025
YoY Growth in year ended Mar 2026 is -68.62% vs 219.65% in Mar 2025
About Makers Laboratories Ltd

Company Coordinates


