
Compare Mamata Machinery with Similar Stocks
Stock DNA
Industrial Manufacturing
INR 976 Cr (Micro Cap)
64.00
39
0.13%
-0.08
8.47%
5.26
Total Returns (Price + Dividend) 
Latest dividend: 0.5 per share ex-dividend date: Sep-12-2025
Risk Adjusted Returns v/s
Returns Beta

News

Mamata Machinery Ltd Upgraded from Strong Sell to Sell on Technical Improvements
Mamata Machinery Ltd has seen its investment rating upgraded from Strong Sell to Sell as of 23 June 2026, driven primarily by improvements in technical indicators and a reassessment of valuation metrics. Despite ongoing challenges in financial performance, the stock’s technical trend has shifted from mildly bearish to sideways, prompting a more cautious but less negative outlook from analysts.
Read full news article
Mamata Machinery Ltd Sees Technical Momentum Shift Amid Mixed Market Signals
Mamata Machinery Ltd has exhibited a notable shift in its technical momentum, moving from a mildly bearish stance to a sideways trend, reflecting a complex interplay of technical indicators. Despite a 4.03% gain on 24 Jun 2026, the micro-cap industrial manufacturing firm remains graded as a Sell with a Mojo Score of 32.0, signalling cautious investor sentiment amid mixed signals from MACD, RSI, and moving averages.
Read full news article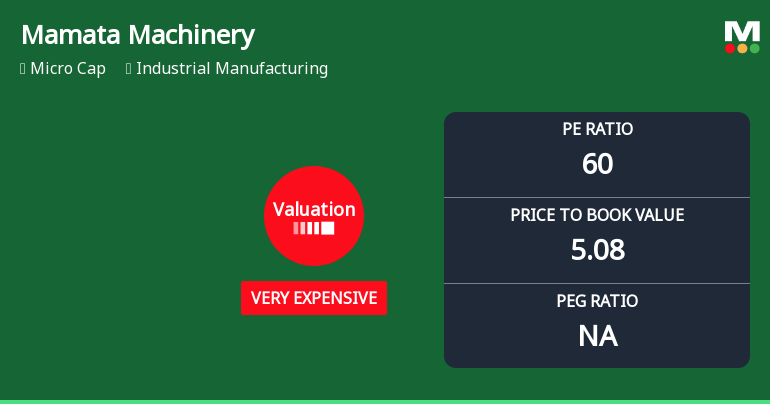
Mamata Machinery Ltd Valuation Shifts Signal Heightened Price Risk
Mamata Machinery Ltd, a micro-cap player in the industrial manufacturing sector, has seen its valuation parameters shift markedly towards the expensive end of the spectrum. With a recent upgrade in its Mojo Grade to Strong Sell and valuation metrics now categorised as very expensive, investors face a challenging landscape as price-to-earnings and price-to-book multiples surge well above peer averages and historical norms.
Read full news article Announcements
Closure of Trading Window
20-Jun-2026 | Source : BSEClosure of Trading Window for considering financial results as on June 30 2026
Announcement under Regulation 30 (LODR)-Analyst / Investor Meet - Intimation
16-Jun-2026 | Source : BSEIntimation of Plant Visit for Investors and Analysts
Announcement under Regulation 30 (LODR)-Analyst / Investor Meet - Outcome
05-Jun-2026 | Source : BSETranscript of Earnings Call held on June 01 2026
Corporate Actions

No Upcoming Board Meetings

Mamata Machinery Ltd has declared 5% dividend, ex-date: 12 Sep 25

No Splits history available

No Bonus history available

No Rights history available
Quality key factors
Valuation key factors
Technicals key factors
 Technical Indicator Scale: Bearish, Mildly Bearish, Sideways, Mildly Bullish, Bullish Turned
 Shareholding Snapshot : Mar 2026
Shareholding Compare (%holding)
Promoters
None
Held by 0 Schemes
Held by 9 FIIs (0.16%)
Mahendra Narsinhbhai Patel (21.17%)
Ajay Upadhyaya (1.85%)
29.15%
Quarterly Results Snapshot (Consolidated) - Mar'26 - QoQ

QoQ Growth in quarter ended Mar 2026 is 9.71% vs 25.95% in Dec 2025
QoQ Growth in quarter ended Mar 2026 is -99.87% vs 73.73% in Dec 2025
Half Yearly Results Snapshot (Consolidated) - Sep'25

Growth in half year ended Sep 2025 is 31.28% vs -27.61% in Sep 2024
Growth in half year ended Sep 2025 is 47.43% vs -23.67% in Sep 2024
Nine Monthly Results Snapshot (Consolidated) - Dec'25
YoY Growth in nine months ended Dec 2025 is 10.94% vs -3.18% in Dec 2024
YoY Growth in nine months ended Dec 2025 is 10.34% vs -6.96% in Dec 2024
Annual Results Snapshot (Consolidated) - Mar'26
YoY Growth in year ended Mar 2026 is -8.48% vs 7.59% in Mar 2025
YoY Growth in year ended Mar 2026 is -63.07% vs 14.40% in Mar 2025
About Mamata Machinery Ltd

Company Coordinates


