
Compare Man Infra with Similar Stocks
Dashboard
Poor long term growth as Net Sales has grown by an annual rate of 8.10% and Operating profit at 5.74% over the last 5 years
With a fall in Net Sales of -5.08%, the company declared Very Negative results in Mar 26
With ROE of 8.9, it has a Very Expensive valuation with a 1.7 Price to Book Value
Falling Participation by Institutional Investors
Below par performance in long term as well as near term
Stock DNA
Construction
INR 3,960 Cr (Small Cap)
20.00
37
1.19%
-0.26
8.85%
1.73
Total Returns (Price + Dividend) 
Latest dividend: 0.7224090338770389 per share ex-dividend date: May-19-2026
Risk Adjusted Returns v/s
Returns Beta

News

Man Infraconstruction Ltd is Rated Strong Sell
Man Infraconstruction Ltd is rated Strong Sell by MarketsMOJO. This rating was last updated on 14 May 2026, reflecting a significant reassessment of the stock’s outlook. However, the analysis and financial metrics discussed here represent the company’s current position as of 21 July 2026, providing investors with the latest insights into its performance and prospects.
Read full news article
Man Infraconstruction Ltd is Rated Strong Sell
Man Infraconstruction Ltd is rated Strong Sell by MarketsMOJO. This rating was last updated on 14 May 2026, reflecting a significant reassessment of the stock’s outlook. However, all fundamentals, returns, and financial metrics discussed here are current as of 10 July 2026, providing investors with the latest perspective on the company’s position.
Read full news article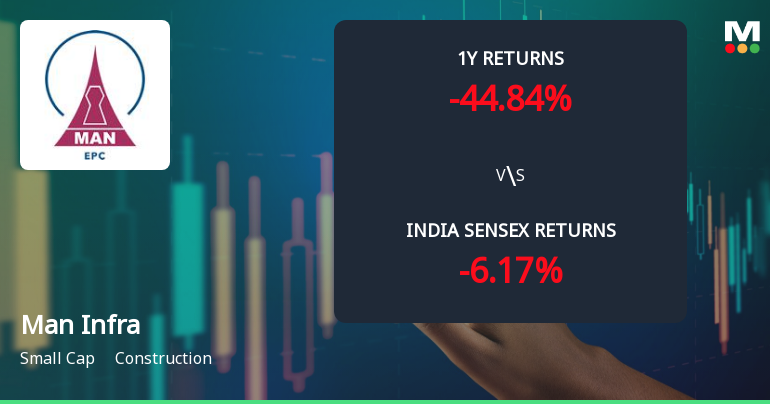
Man Infraconstruction Ltd Faces Bearish Momentum Amid Technical Downturn
Man Infraconstruction Ltd has experienced a marked shift in its technical momentum, with key indicators signalling a deepening bearish trend. The stock’s recent downgrade to a Strong Sell by MarketsMOJO reflects deteriorating price action and weakening investor sentiment, underscored by negative returns across multiple timeframes compared to the broader Sensex.
Read full news article Announcements
Announcement under Regulation 30 (LODR)-Newspaper Publication
18-Jul-2026 | Source : BSEPlease find enclosed newspaper publication w.r.t. the 24th Annual General Meeting Annual Report and e-Voting information for the purpose of Annual General Meeting for FY 2025-26.
Intimation Under Reg 36(1)(B) Of SEBI LODR Regulations 2015
17-Jul-2026 | Source : BSEPursuant to Reg 36(1)(b) of SEBI LODR Regulations 2015 the Company has sent a letter providing weblink of the Annual Report 2025-26 to the Members who have not registered their email ids.
Reg. 34 (1) Annual Report.
17-Jul-2026 | Source : BSEPlease find enclosed Annual Report along with AGM Notice for F.Y. 2025-26.
Corporate Actions

No Upcoming Board Meetings

Man Infraconstruction Ltd has declared 36% dividend, ex-date: 19 May 26

Man Infraconstruction Ltd has announced 2:10 stock split, ex-date: 28 Aug 14

Man Infraconstruction Ltd has announced 1:2 bonus issue, ex-date: 17 Nov 21

No Rights history available
Quality key factors
Valuation key factors
Technicals key factors
 Technical Indicator Scale: Bearish, Mildly Bearish, Sideways, Mildly Bullish, Bullish Turned
 Shareholding Snapshot : Jun 2026
Shareholding Compare (%holding)
Promoters
None
Held by 2 Schemes (1.13%)
Held by 49 FIIs (1.91%)
Parag Kishor Shah (29.73%)
Suketu Ramesh Shah (1.86%)
25.03%
Quarterly Results Snapshot (Consolidated) - Mar'26 - QoQ

QoQ Growth in quarter ended Mar 2026 is -5.08% vs 3.06% in Dec 2025

QoQ Growth in quarter ended Mar 2026 is -8.81% vs -14.92% in Dec 2025
Half Yearly Results Snapshot (Consolidated) - Sep'25
Growth in half year ended Sep 2025 is -42.01% vs -21.11% in Sep 2024
Growth in half year ended Sep 2025 is -9.22% vs -19.76% in Sep 2024
Nine Monthly Results Snapshot (Consolidated) - Dec'25
YoY Growth in nine months ended Dec 2025 is -40.44% vs -15.77% in Dec 2024
YoY Growth in nine months ended Dec 2025 is -23.34% vs -12.47% in Dec 2024
Annual Results Snapshot (Consolidated) - Mar'26
YoY Growth in year ended Mar 2026 is -43.10% vs -12.30% in Mar 2025
YoY Growth in year ended Mar 2026 is -29.05% vs -5.88% in Mar 2025
About Man Infraconstruction Ltd

Company Coordinates


