
Compare Manaksia Alumi. with Similar Stocks
Dashboard
Healthy long term growth as Operating profit has grown by an annual rate 51.73%
Positive results in Mar 26
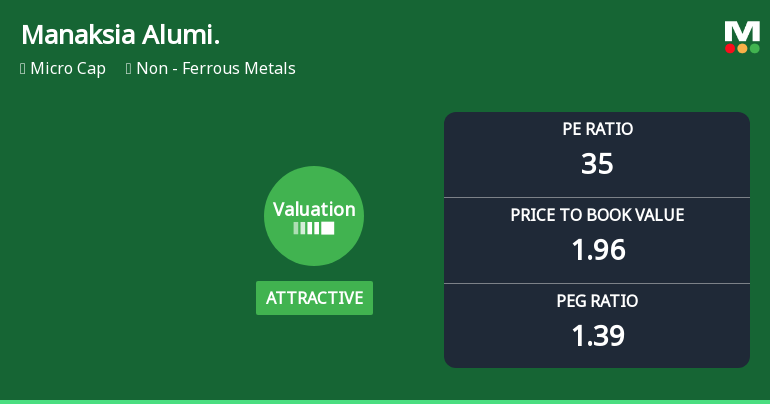
With ROCE of 9.8, it has a Attractive valuation with a 1.3 Enterprise value to Capital Employed
Majority shareholders : Promoters
Market Beating performance in long term as well as near term
Stock DNA
Non - Ferrous Metals
INR 269 Cr (Micro Cap)
33.00
14
0.17%
1.61
5.59%
2.01
Total Returns (Price + Dividend) 
Latest dividend: 0.07 per share ex-dividend date: Sep-08-2025
Risk Adjusted Returns v/s
Returns Beta

News
Manaksia Aluminium Company Ltd: Valuation Shift Enhances Price Attractiveness Amid Strong Market Returns
Manaksia Aluminium Company Ltd has witnessed a notable shift in its valuation parameters, moving from a very attractive to an attractive rating, reflecting a growing investor appetite amid improving fundamentals and robust price performance. The stock’s recent surge of 17.71% in a single day underscores renewed market confidence, supported by a strong year-to-date return of 39.91%, significantly outperforming the Sensex’s negative 13.26% over the same period.
Read full news article
Manaksia Aluminium Company Ltd Upgraded to Buy on Strong Financial and Technical Signals
Manaksia Aluminium Company Ltd has seen its investment rating upgraded from Hold to Buy, reflecting significant improvements across technical indicators, valuation metrics, financial trends, and overall quality. This upgrade, effective from 2 June 2026, underscores the company’s robust operational performance and favourable market positioning within the non-ferrous metals sector.
Read full news article
Golden Cross Forms in Manaksia Aluminium Company Ltd — On a Day the Stock Fell 1.5%. What the Mixed Signals Mean
The 50-day moving average has crossed above the 200-day moving average for Manaksia Aluminium Company Ltd, signalling a golden cross on 2 Jun 2026. Yet, the stock declined 1.5% on the day the cross formed, and while weekly and monthly MACD indicators are bullish, other technical signals and recent price action present a more nuanced picture that demands closer examination.
Read full news article Announcements
Compliances-Reg.24(A)-Annual Secretarial Compliance
20-May-2026 | Source : BSEAnnual Secretarial Compliance Report for the FY 2025-26
Announcement under Regulation 30 (LODR)-Newspaper Publication
15-May-2026 | Source : BSENewspaper Publication for the opening of the Special Window for re-lodgement of transfer requests of physical shares.
Announcement under Regulation 30 (LODR)-Newspaper Publication
09-May-2026 | Source : BSENewspaper Publication of Financial Results of the Company for the quarter and year ended 31.03.2026
Corporate Actions

No Upcoming Board Meetings

Manaksia Aluminium Company Ltd has declared 7% dividend, ex-date: 08 Sep 25

No Splits history available

No Bonus history available

No Rights history available
Quality key factors
Valuation key factors
Technicals key factors
 Technical Indicator Scale: Bearish, Mildly Bearish, Sideways, Mildly Bullish, Bullish Turned
 Shareholding Snapshot : Mar 2026
Shareholding Compare (%holding)
Promoters
None
Held by 0 Schemes
Held by 1 FIIs (0.01%)
Sunil Kumar Agrawal (37.15%)
Monet Securities Pvt Ltd (3.37%)
16.48%
Quarterly Results Snapshot (Standalone) - Mar'26 - QoQ

QoQ Growth in quarter ended Mar 2026 is 9.14% vs 8.70% in Dec 2025
QoQ Growth in quarter ended Mar 2026 is 96.36% vs 48.65% in Dec 2025
Half Yearly Results Snapshot (Standalone) - Sep'25

Growth in half year ended Sep 2025 is 14.33% vs 21.56% in Sep 2024
Growth in half year ended Sep 2025 is 11.25% vs 5.26% in Sep 2024
Nine Monthly Results Snapshot (Standalone) - Dec'25
YoY Growth in nine months ended Dec 2025 is 9.72% vs 26.30% in Dec 2024
YoY Growth in nine months ended Dec 2025 is 6.67% vs 15.38% in Dec 2024
Annual Results Snapshot (Standalone) - Mar'26
YoY Growth in year ended Mar 2026 is 10.76% vs 17.73% in Mar 2025
YoY Growth in year ended Mar 2026 is 24.96% vs 18.86% in Mar 2025
About Manaksia Aluminium Company Ltd

Company Coordinates


