
Compare Manbro Indust. with Similar Stocks
Stock DNA
Gems, Jewellery And Watches
INR 403 Cr (Micro Cap)
718.00
21
0.00%
0.35
6.27%
8.73
Total Returns (Price + Dividend) 
Manbro Indust. for the last several years.
Risk Adjusted Returns v/s
Returns Beta

News
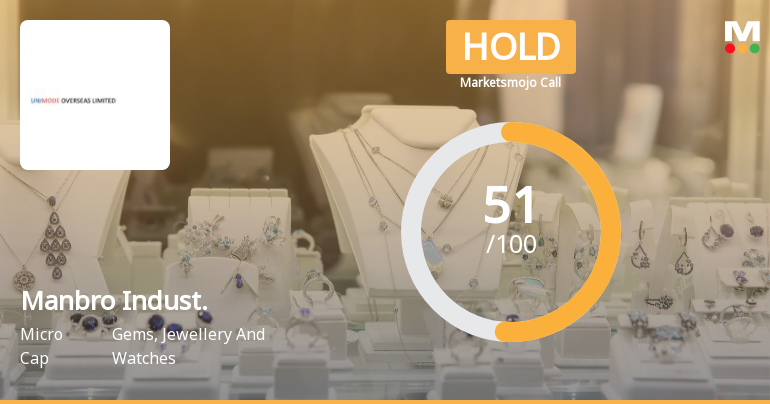
Manbro Industries Ltd Upgraded to Hold on Technical Improvements and Market Resilience
Manbro Industries Ltd, a micro-cap player in the Gems, Jewellery and Watches sector, has seen its investment rating upgraded from Sell to Hold as of 11 June 2026. This change reflects a nuanced improvement across technical indicators, valuation considerations, financial trends, and overall quality metrics, signalling a cautious but more optimistic outlook for investors.
Read full news article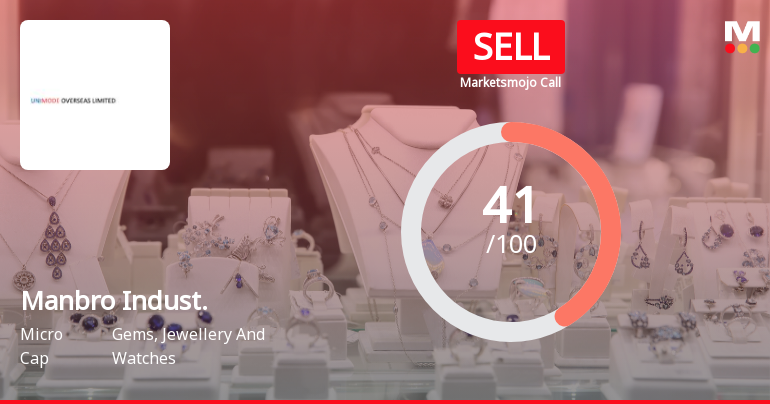
Manbro Industries Ltd Downgraded to Sell Amid Valuation and Growth Concerns
Manbro Industries Ltd, a micro-cap player in the Gems, Jewellery and Watches sector, has seen its investment rating downgraded to Sell with a Mojo Score of 41.0 as of 1 June 2026. This shift reflects a complex interplay of factors including an upgrade in quality metrics, a sharp deterioration in valuation, a sideways technical trend, and a flat financial performance, prompting a cautious stance despite some positive long-term returns.
Read full news article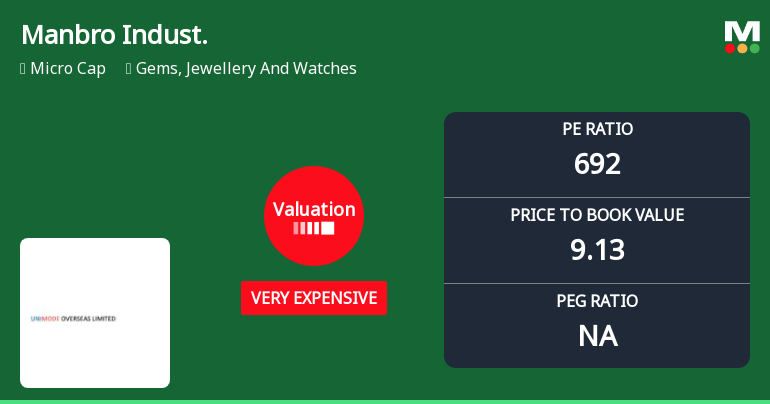
Manbro Industries Ltd Valuation Shifts Signal Elevated Price Risk Amid Sector Comparisons
Manbro Industries Ltd, a micro-cap player in the Gems, Jewellery and Watches sector, has seen a marked deterioration in its valuation attractiveness as key multiples surge to historically elevated levels. The company’s price-to-earnings (P/E) ratio has ballooned to 692.13, while its price-to-book value (P/BV) stands at 9.13, signalling a shift from risky to very expensive territory. This article analyses the implications of these valuation changes in the context of peer comparisons, historical benchmarks, and recent market performance.
Read full news article Announcements
Announcement under Regulation 30 (LODR)-Press Release / Media Release
09-Jun-2026 | Source : BSEPursuant to the provisions of Regulation 30 of SEBI (Listing Obligations and Disclosure Requirements) Regulations 2015 please find enclosed herewith Press Release dated 9th June 2026 relating to the proposed merger of KD Green Industries Limited and KD Iron & Steel Private Limited subject to completion of due diligence statutory approvals regulatory clearances and other necessary approvals.
Intimation Under Regulation 30 Of SEBI (Listing Obligations And Disclosure Requirements) Regulations 2015- Merger
09-Jun-2026 | Source : BSEPursuant to Regulation 30 of the SEBI (Listing Obligations and Disclosure Requirement) Regulations 2015 we hereby inform you that the Board of Directors in their meeting held today i.e 9th June 2026 decided to merge KD Green Industries Limited and KD Iron & Steel Private Limited the companies having common promoters. The modalities of Merger including valuation/swap ratio will be finalized after due diligence and consultation with professionals and subject to the regulatory and other approvals.
Board Meeting Outcome for Outcome Of Board Meeting And Intimation Under Regulation 30 Of SEBI (Listing Obligations And Disclosure Requirements) Regulations 2015.
09-Jun-2026 | Source : BSEPursuant to Regulation 30 of the SEBI (Listing Obligations and Disclosure Requirement) Regulations 2015 we hereby inform you that the Board of Directors in their meeting held today i.e 9th June 2026 decided to merge KD Green Industries Limited and KD Iron & Steel Private Limited the companies having common promoters. The modalities of Merger including valuation/swap ratio will be finalized after due diligence and consultation with professionals and subject to the regulatory and other approvals.
Corporate Actions

No Upcoming Board Meetings

No Dividend history available

Manbro Industries Ltd has announced 1:10 stock split, ex-date: 25 Mar 26

No Bonus history available

No Rights history available
Quality key factors
Valuation key factors
Technicals key factors
 Technical Indicator Scale: Bearish, Mildly Bearish, Sideways, Mildly Bullish, Bullish Turned
 Shareholding Snapshot : May 2026
Shareholding Compare (%holding)
Promoters
None
Held by 0 Schemes
Held by 0 FIIs
Dilip Kumar Goenka (26.91%)
Securocrop Securities India Private Limited (20.19%)
16.44%
Quarterly Results Snapshot (Standalone) - Mar'26 - QoQ
QoQ Growth in quarter ended Mar 2026 is 0.00% vs 0.00% in Dec 2025

QoQ Growth in quarter ended Mar 2026 is 113.33% vs -200.00% in Dec 2025
Half Yearly Results Snapshot (Standalone) - Sep'25

Growth in half year ended Sep 2025 is -100.00% vs -61.49% in Sep 2024
Growth in half year ended Sep 2025 is 395.83% vs 20.00% in Sep 2024
Nine Monthly Results Snapshot (Standalone) - Dec'25
YoY Growth in nine months ended Dec 2025 is -100.00% vs -89.86% in Dec 2024
YoY Growth in nine months ended Dec 2025 is 354.55% vs -266.67% in Dec 2024
Annual Results Snapshot (Standalone) - Mar'26
YoY Growth in year ended Mar 2026 is -81.12% vs -91.83% in Mar 2025
YoY Growth in year ended Mar 2026 is -4.92% vs 154.17% in Mar 2025
About Manbro Industries Ltd

Company Coordinates


