
Compare Mangal Electrica with Similar Stocks
Dashboard
Strong ability to service debt as the company has a low Debt to EBITDA ratio of 0.66 times
Poor long term growth as Operating profit has grown by an annual rate 37.47% of over the last 5 years
Flat results in Mar 26
With ROE of 7.3, it has a Very Attractive valuation with a 1.5 Price to Book Value
Falling Participation by Institutional Investors
Stock DNA
Other Electrical Equipment
INR 861 Cr (Micro Cap)
20.00
56
0.00%
-0.08
7.31%
1.41
Total Returns (Price + Dividend) 
Mangal Electrica for the last several years.
Risk Adjusted Returns v/s
Returns Beta

News
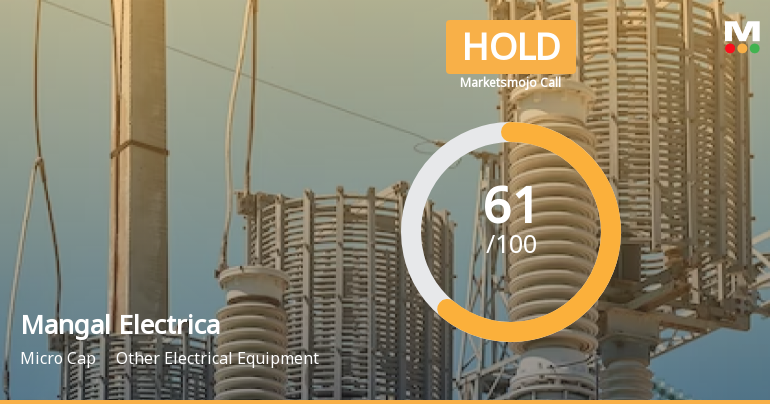
Mangal Electrical Industries Ltd is Rated Hold
Mangal Electrical Industries Ltd is rated 'Hold' by MarketsMOJO, with this rating last updated on 04 May 2026. However, the analysis and financial metrics discussed here reflect the company’s current position as of 10 June 2026, providing investors with an up-to-date view of its fundamentals, valuation, financial trends, and technical outlook.
Read full news article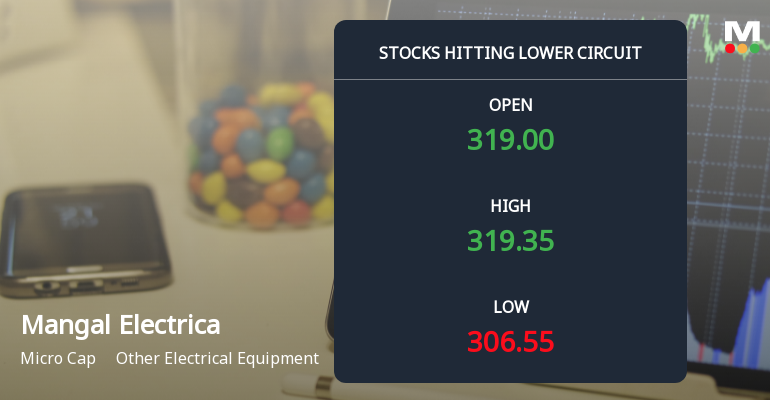
Mangal Electrical Industries Ltd Locks at Lower Circuit With 5% Loss — Sellers Queue, No Buyers in Sight
At Rs 303.4, sellers were still queuing — but there were no buyers willing to take the other side. Mangal Electrical Industries Ltd locked at its lower circuit of 5% on 8 Jun 2026, with unfilled sell orders and a frozen price, signalling a pronounced imbalance between supply and demand.
Read full news article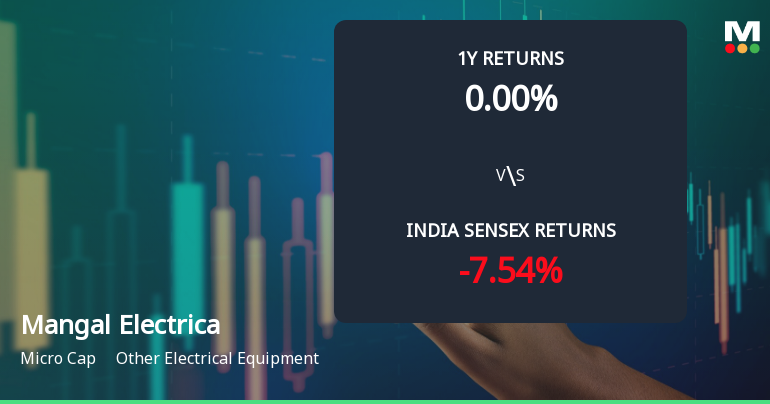
Mangal Electrical Industries Ltd Shows Mildly Bullish Momentum Amid Technical Upgrades
Mangal Electrical Industries Ltd, a micro-cap player in the Other Electrical Equipment sector, has witnessed a notable shift in its technical momentum, moving from a sideways trend to a mildly bullish stance. This change is underscored by improvements in key technical indicators such as the MACD and Bollinger Bands on the weekly chart, alongside a recent upgrade in its MarketsMOJO grade from Sell to Hold, signalling a cautious but positive outlook for investors.
Read full news article Announcements
Announcement under Regulation 30 (LODR)-Analyst / Investor Meet - Intimation
11-Jun-2026 | Source : BSEPursuant to Regulation 30 of Listing Regulations intimation that the Company is organizing a plant visit followed by management interaction for Analysts / Investors on 18.06.2026.
Announcement under Regulation 30 (LODR)-Resignation of Chief Financial Officer (CFO)
04-Jun-2026 | Source : BSEUnder Regulation 30(LODR)-Resignation of Chief Financial Officer (KMP)
Format of the Initial Disclosure to be made by an entity identified as a Large Corporate : Annexure A
21-May-2026 | Source : BSEFormat of Initial Disclosure to be made by an entity identified as a Large Corporate.
| Sr. No. | Particulars | Details |
| 1 | Name of Company | Mangal Electrical Industries Ltd |
| 2 | CIN NO. | L31909RI2008PLC026255 |
| 3 | Outstanding borrowing of company as on 31st March / 31st December as applicable (in Rs cr) | 45.43 |
| 4 | Highest Credit Rating during the previous FY | BBB+ |
| 4a | Name of the Credit Rating Agency issuing the Credit Rating mentioned in (4) | INFOMERICS VALUATION AND RATING PVT. LTD. |
| 5 | Name of Stock Exchange# in which the fine shall be paid in case of shortfall in the required borrowing under the framework | NSE |
Designation: COMPANY SECRETARY AND COMPLIANCE OFFICER
EmailId: compliance@mangals.com
Designation: CHIEF FINANCIAL OFFICER
EmailId: CFO@MANGALS.COM
Date: 21/05/2026
Note: In terms para of 3.2(ii) of the circular beginning F.Y 2022 in the event of shortfall in the mandatory borrowing through debt securities a fine of 0.2% of the shortfall shall be levied by Stock Exchanges at the end of the two-year block period. Therefore an entity identified as LC shall provide in its initial disclosure for a financial year the name of Stock Exchange to which it would pay the fine in case of shortfall in the mandatory borrowing through debt markets.
Corporate Actions

No Upcoming Board Meetings

No Dividend history available

No Splits history available

No Bonus history available

No Rights history available
Quality key factors
Valuation key factors
Technicals key factors
 Technical Indicator Scale: Bearish, Mildly Bearish, Sideways, Mildly Bullish, Bullish Turned
 Shareholding Snapshot : Mar 2026
Shareholding Compare (%holding)
Promoters
None
Held by 0 Schemes
Held by 6 FIIs (2.2%)
Rahul Mangal (30.48%)
Abakkus Diversified Alpha Fund (2.89%)
14.93%
Quarterly Results Snapshot (Standalone) - Mar'26 - QoQ

QoQ Growth in quarter ended Mar 2026 is 14.81% vs 1.26% in Dec 2025

QoQ Growth in quarter ended Mar 2026 is -4.78% vs 0.68% in Dec 2025
Half Yearly Results Snapshot (Standalone) - Sep'25
Not Applicable: The company has declared_date for only one period
Not Applicable: The company has declared_date for only one period
Nine Monthly Results Snapshot (Standalone) - Dec'25
Not Applicable: The company has declared_date for only one period
Not Applicable: The company has declared_date for only one period
Annual Results Snapshot (Standalone) - Mar'26
YoY Growth in year ended Mar 2026 is 5.51% vs 22.23% in Mar 2025
YoY Growth in year ended Mar 2026 is -8.75% vs 125.82% in Mar 2025
About Mangal Electrical Industries Ltd

Company Coordinates


