
Compare Mangalam Drugs with Similar Stocks
Dashboard
With a Operating Losses, the company has a Weak Long Term Fundamental Strength
- Poor long term growth as Net Sales has grown by an annual rate of -8.78% and Operating profit at -182.89% over the last 5 years
- Low ability to service debt as the company has a high Debt to EBITDA ratio of 2.49 times
The company has declared Negative results for the last 4 consecutive quarters
Risky - Negative Operating Profits
Reducing Promoter Confidence
Stock DNA
Pharmaceuticals & Biotechnology
INR 44 Cr (Micro Cap)
NA (Loss Making)
31
0.00%
0.72
-15.52%
0.36
Total Returns (Price + Dividend) 
Latest dividend: 0.5 per share ex-dividend date: Dec-21-2017
Risk Adjusted Returns v/s
Returns Beta

News

Mangalam Drugs and Organics Ltd is Rated Strong Sell
Mangalam Drugs and Organics Ltd is rated Strong Sell by MarketsMOJO, with this rating last updated on 19 May 2025. However, the analysis and financial metrics presented here reflect the company’s current position as of 02 April 2026, providing investors with an up-to-date view of its fundamentals, returns, and overall outlook.
Read full news article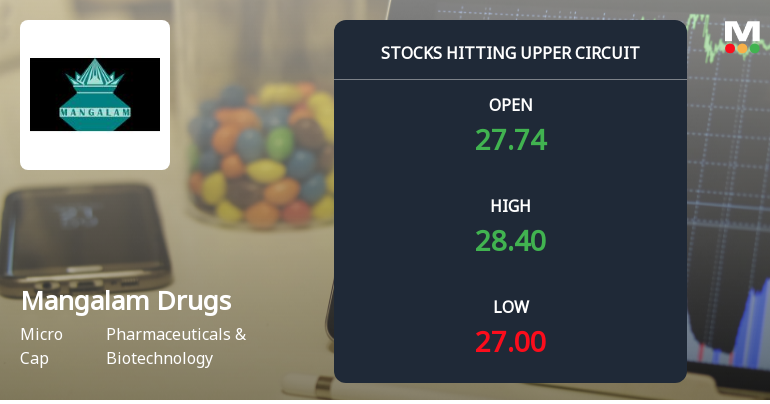
Mangalam Drugs and Organics Ltd Locks at Upper Circuit With 5% Gain — Buyers Queue, Sellers Absent
At Rs 28.50, the buying was done — not because demand dried up, but because the exchange wouldn't let the stock go any higher. Mangalam Drugs and Organics Ltd locked at its upper circuit of 5% on 1 Apr 2026, with buyers queuing and no sellers willing to part with shares.
Read full news article
Mangalam Drugs and Organics Ltd Locks at Lower Circuit With 4.92% Loss — Sellers Queue, No Buyers in Sight
At Rs 27.05, sellers were still queuing — but there were no buyers willing to take the other side. Mangalam Drugs and Organics Ltd locked at its lower circuit of 4.92% on 30 Mar 2026, with unfilled sell orders and a frozen price, reflecting persistent selling pressure in a micro-cap stock with limited liquidity.
Read full news article Announcements
Mangalam Drugs And Organics Limited - Reply to Clarification- Financial results
09-Dec-2019 | Source : NSEMangalam Drugs And Organics Limitedalam Drugs And Organics Limited for the quarter ended 30-Sep-2019 with respect to Regulation 33 of the SEBI (Listing Obligations and Disclosure Requirements) Regulations, 2015.
Mangalam Drugs And Organics Limited - Clarification - Financial Results
21-Nov-2019 | Source : NSEMangalam Drugs And Organics Limitedgs And Organics Limited for the quarter ended 30-Sep-2019 with respect to Regulation 33 of the SEBI (Listing Obligations and Disclosure Requirements) Regulations, 2015.
Mangalam Drugs And Organics Limited - Other General Purpose
15-Nov-2019 | Source : NSEMangalam Drugs And Organics Limited has informed the Exchange regarding Compliance under Regulation 23(9) of the SEBI (Listing Obligations and Disclosure Requirements) Regulations, 2015.
Corporate Actions

No Upcoming Board Meetings

Mangalam Drugs and Organics Ltd has declared 5% dividend, ex-date: 21 Dec 17

No Splits history available

No Bonus history available

No Rights history available
Quality key factors
Valuation key factors
Technicals key factors
 Technical Indicator Scale: Bearish, Mildly Bearish, Sideways, Mildly Bullish, Bullish Turned
 Shareholding Snapshot : Dec 2025
Shareholding Compare (%holding)
Non Institution
7.0903
Held by 0 Schemes
Held by 2 FIIs (0.13%)
Shree Rasbihari Trading & Investment Pvt Ltd (6.21%)
Ambika Food Industries Private Limited (1.04%)
57.52%
Quarterly Results Snapshot (Consolidated) - Dec'25 - QoQ

QoQ Growth in quarter ended Dec 2025 is 18.07% vs -13.62% in Sep 2025

QoQ Growth in quarter ended Dec 2025 is -33.88% vs 46.74% in Sep 2025
Annual Results Snapshot (Consolidated) - Mar'25
YoY Growth in year ended Mar 2025 is -13.01% vs -1.47% in Mar 2024
YoY Growth in year ended Mar 2025 is 174.09% vs -814.17% in Mar 2024
About Mangalam Drugs and Organics Ltd

Company Coordinates


