
Compare Mangalam Global with Similar Stocks
Dashboard
Healthy long term growth as Net Sales has grown by an annual rate of 28.68% and Operating profit at 54.95%
With a growth in Net Profit of 46.65%, the company declared Outstanding results in Mar 26
With ROCE of 13.4, it has a Very Attractive valuation with a 1.7 Enterprise value to Capital Employed
Stock DNA
Other Agricultural Products
INR 537 Cr (Micro Cap)
15.00
25
0.06%
0.76
14.28%
2.16
Total Returns (Price + Dividend) 
Latest dividend: 0.01 per share ex-dividend date: Jul-18-2025
Risk Adjusted Returns v/s
Returns Beta

News
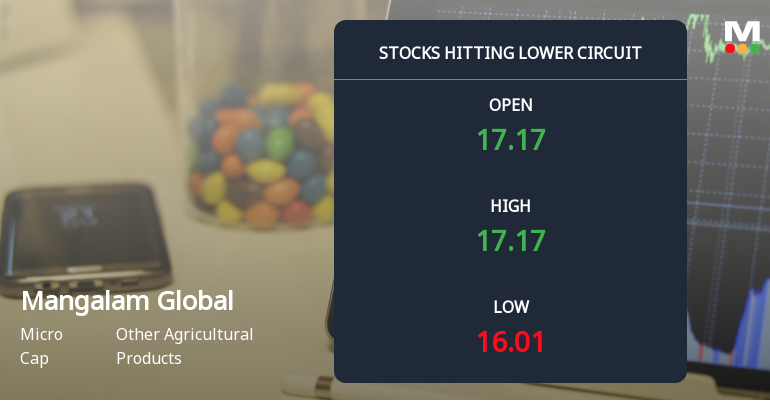
Mangalam Global Enterprise Ltd Locks at Lower Circuit With 4.1% Loss — Sellers Queue, No Buyers in Sight
At Rs 16.02, Mangalam Global Enterprise Ltd locked at its lower circuit limit of 5% on 14 Jul 2026, with persistent unfilled supply as sellers remained eager to exit but buyers stayed absent. This freeze at the floor price highlights the acute selling pressure and liquidity constraints faced by the micro-cap stock.
Read full news article
Mangalam Global Enterprise Ltd is Rated Strong Buy
Mangalam Global Enterprise Ltd is rated Strong Buy by MarketsMOJO, with this rating last updated on 16 June 2026. However, the analysis and financial metrics discussed here reflect the company’s current position as of 09 July 2026, providing investors with the latest insights into its performance and outlook.
Read full news article
Mangalam Global Enterprise Ltd Locks at Upper Circuit With 5% Gain — Buyers Queue, Sellers Absent
At Rs 16.70, the buying was done — not because demand dried up, but because the exchange wouldn't let the stock go any higher. Mangalam Global Enterprise Ltd locked at its upper circuit of 5% on 30 Jun 2026, with buyers queuing and no sellers willing to part with shares.
Read full news article Announcements
Corporate Actions

No Upcoming Board Meetings

Mangalam Global Enterprise Ltd has declared 1% dividend, ex-date: 17 Jul 26

Mangalam Global Enterprise Ltd has announced 1:2 stock split, ex-date: 04 Mar 25

Mangalam Global Enterprise Ltd has announced 1:2 bonus issue, ex-date: 31 Aug 20

Mangalam Global Enterprise Ltd has announced 1:7 rights issue, ex-date: 24 May 24
Quality key factors
Valuation key factors
Technicals key factors
 Technical Indicator Scale: Bearish, Mildly Bearish, Sideways, Mildly Bullish, Bullish Turned
 Shareholding Snapshot : Mar 2026
Shareholding Compare (%holding)
Promoters
None
Held by 0 Schemes
Held by 2 FIIs (0.18%)
Chandragupt Prakash Mangal (17.38%)
Chungath Karunakaran Padma Kumar (3.9%)
20.41%
Quarterly Results Snapshot (Consolidated) - Mar'26 - QoQ

QoQ Growth in quarter ended Mar 2026 is 40.71% vs 7.14% in Dec 2025
QoQ Growth in quarter ended Mar 2026 is 46.65% vs -52.19% in Dec 2025
Half Yearly Results Snapshot (Consolidated) - Sep'25

Growth in half year ended Sep 2025 is 25.89% vs 62.57% in Sep 2024
Growth in half year ended Sep 2025 is 109.24% vs 109.40% in Sep 2024
Nine Monthly Results Snapshot (Consolidated) - Dec'25
YoY Growth in nine months ended Dec 2025 is 33.00% vs 34.59% in Dec 2024
YoY Growth in nine months ended Dec 2025 is 82.80% vs 112.46% in Dec 2024
Annual Results Snapshot (Consolidated) - Mar'26
YoY Growth in year ended Mar 2026 is 48.34% vs 24.07% in Mar 2025
YoY Growth in year ended Mar 2026 is 95.76% vs 14.30% in Mar 2025
About Mangalam Global Enterprise Ltd

Company Coordinates


