
Compare Mangalam Industr with Similar Stocks
Stock DNA
Non Banking Financial Company (NBFC)
INR 88 Cr (Micro Cap)
NA (Loss Making)
20
0.00%
0.00
-1.35%
1.19
Total Returns (Price + Dividend) 
Latest dividend: 0.01 per share ex-dividend date: Jan-28-2025
Risk Adjusted Returns v/s
Returns Beta

News

Mangalam Industrial Finance Ltd is Rated Strong Sell
Mangalam Industrial Finance Ltd is rated Strong Sell by MarketsMOJO. This rating was last updated on 20 Dec 2024. However, the analysis and financial metrics discussed here reflect the company’s current position as of 04 June 2026, providing investors with the latest insights into its performance and outlook.
Read full news article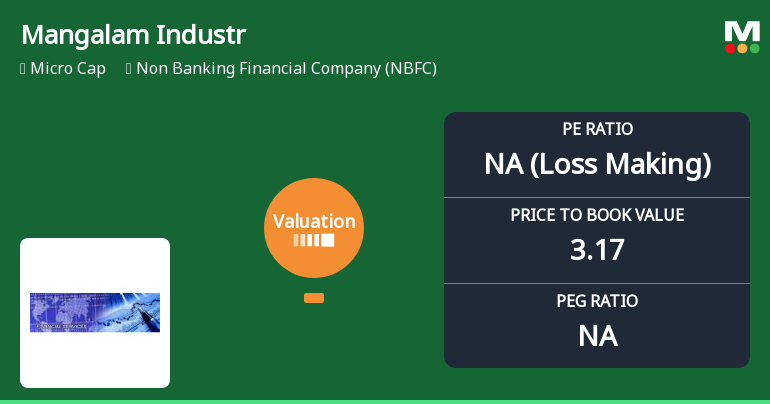
Mangalam Industrial Finance Ltd Faces Sharp Valuation Reassessment Amidst Market Challenges
Mangalam Industrial Finance Ltd, a micro-cap player in the Non Banking Financial Company (NBFC) sector, has seen its valuation metrics deteriorate significantly, shifting from a previously expensive status to a risky valuation grade. This change comes amid a steep decline in its share price and worsening financial ratios, raising concerns about its price attractiveness relative to peers and historical benchmarks.
Read full news article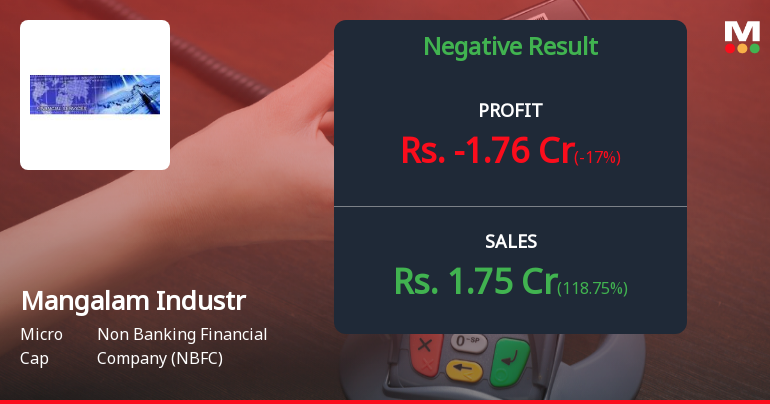
Mangalam Industrial Finance Q4 FY26: Massive Loss Triggers 60% Annual Decline
Mangalam Industrial Finance Ltd., a micro-cap non-banking financial company specialising in electric two-wheeler financing, reported a catastrophic quarterly loss of ₹1.76 crores for Q4 FY26, marking a dramatic reversal from the ₹0.10 crores profit recorded in Q4 FY25. The shocking results sent the stock plummeting 4.29% to ₹0.67 on June 1, 2026, extending a brutal year-long decline that has eroded 60.12% of shareholder value and pushed the company's market capitalisation down to a mere ₹95.48 crores.
Read full news article Announcements
Announcement under Regulation 30 (LODR)-Resignation of Director
09-Jun-2026 | Source : BSEAttached Intimation for Resignation of Independent Director of the Company with effect from 30.06.2026
Announcement under Regulation 30 (LODR)-Resignation of Company Secretary / Compliance Officer
01-Jun-2026 | Source : BSEAttached herewith Resignation of Company Secretary and Compliance Officer w.e.f 01st June 2026
Announcement under Regulation 30 (LODR)-Newspaper Publication
01-Jun-2026 | Source : BSEAttached Newspaper Publication for Audited Standalone Financial Results for Financial Year ended 31st March 2026
Corporate Actions

No Upcoming Board Meetings

Mangalam Industrial Finance Ltd has declared 1% dividend, ex-date: 28 Jan 25

Mangalam Industrial Finance Ltd has announced 1:10 stock split, ex-date: 29 Nov 16

No Bonus history available

Mangalam Industrial Finance Ltd has announced 1:2 rights issue, ex-date: 23 Sep 25
Quality key factors
Valuation key factors
Technicals key factors
 Technical Indicator Scale: Bearish, Mildly Bearish, Sideways, Mildly Bullish, Bullish Turned
 Shareholding Snapshot : Mar 2026
Shareholding Compare (%holding)
Non Institution
12.6644
Held by 0 Schemes
Held by 0 FIIs
Sojan V Avirachan (17.54%)
D. Y. Captive Projects Llp (6.14%)
54.57%
Quarterly Results Snapshot (Standalone) - Mar'26 - QoQ

QoQ Growth in quarter ended Mar 2026 is 118.75% vs -13.04% in Dec 2025

QoQ Growth in quarter ended Mar 2026 is -17,700.00% vs -97.56% in Dec 2025
Half Yearly Results Snapshot (Standalone) - Sep'25
Growth in half year ended Sep 2025 is 2.25% vs 43.55% in Sep 2024
Growth in half year ended Sep 2025 is 7.14% vs 438.46% in Sep 2024
Nine Monthly Results Snapshot (Standalone) - Dec'25
YoY Growth in nine months ended Dec 2025 is -3.68% vs 28.91% in Dec 2024
YoY Growth in nine months ended Dec 2025 is -32.74% vs 318.52% in Dec 2024
Annual Results Snapshot (Standalone) - Mar'26
YoY Growth in year ended Mar 2026 is 20.22% vs 0.56% in Mar 2025
YoY Growth in year ended Mar 2026 is -181.30% vs 547.37% in Mar 2025
About Mangalam Industrial Finance Ltd

Company Coordinates


