Mankind Pharma

  • Market Cap: Mid Cap
  • Industry: Pharmaceuticals & Biotechnology
  • ISIN: INE634S01028
  • NSEID: MANKIND
  • BSEID: 543904
INR
2,024.00
36.2 (1.82%)
BSENSE

Mar 25

BSE+NSE Vol: 12.44 lacs

  • Price Points
  • Score
  • Mojo Parameters
  • Total Return
  • News and Corporate Actions
  • Key factors
  • Shareholding
  • Financials
  • CompanyCV
stock-summaryPrice Point
High/Low

1Day

52 Week

Valuation
Technical
Day's Volume

CASH

12.44 lacs (30.07%) Volume

Shareholding (Dec 2025)

FII

11.34%

Held by 510 FIIs

DII

2.83%

Held by 33 DIIs

Promoter

72.66%

What does Mankind Pharma do?

06-Jun-2025

Mankind Pharma Ltd is a large-cap pharmaceutical company, incorporated in 1991, with net sales of ₹3,079 Cr and a net profit of ₹421 Cr for the quarter ending March 2025. It has a market cap of ₹97,159 Cr and a P/E ratio of 49.00.

Overview:<BR>Mankind Pharma Ltd is a large-cap company operating in the Pharmaceuticals & Biotechnology industry.<BR><BR>History:<BR>Mankind Pharma Limited was incorporated on July 3, 1991, as a Private Limited Company and was converted to a Public Limited Company on July 14, 2005. The latest quarterly results report net sales and profit for the period ending March 2025.<BR><BR>Financial Snapshot:<BR>- Net Sales: 3,079 Cr (Quarterly Results - Mar 2025)<BR>- Net Profit: 421 Cr (Quarterly Results - Mar 2025)<BR>- Market Cap: Rs 97,159 Cr (Large Cap)<BR><BR>Key Metrics:<BR>- P/E: 49.00<BR>- Industry P/E: 35<BR>- Dividend Yield: 0.00%<BR>- Debt-Equity: -0.40<BR>- Return on Equity: 20.02%<BR>- Price to Book: 9.22<BR><BR>Contact Details:<BR>Registrar Address: Not available.

View full answer

Has Mankind Pharma declared dividend?

06-Jun-2025

No Dividend History Available

Who are the peers of the Mankind Pharma?

16-Jul-2025

Mankind Pharma's peers include Sun Pharma, Divi's Lab, Cipla, Torrent Pharma, Dr Reddy's Labs, Zydus Lifesciences, Lupin, Abbott India, and Aurobindo Pharma. Key metrics show excellent management and capital structures for most peers, with Divi's Lab leading in 1-year returns at 49.58%, while Mankind Pharma has a return of 23.90%.

Peers: The peers of Mankind Pharma are Sun Pharma.Inds., Divi's Lab., Cipla, Torrent Pharma, Dr Reddy's Labs, Zydus Lifesci., Lupin, Abbott India, and Aurobindo Pharma.<BR><BR>Quality Snapshot: Excellent management risk is observed at Sun Pharma.Inds., Divi's Lab., Cipla, Torrent Pharma, Mankind Pharma, Dr Reddy's Labs, Zydus Lifesci., Abbott India, and Aurobindo Pharma, while Average management risk is found at Lupin and Glenmark Pharma. Growth is excellent for Sun Pharma.Inds., Cipla, Mankind Pharma, Dr Reddy's Labs, Zydus Lifesci., and Lupin, while below average growth is noted for Divi's Lab., Torrent Pharma, Aurobindo Pharma, and the rest. Excellent capital structure is seen at Sun Pharma.Inds., Divi's Lab., Cipla, Mankind Pharma, Dr Reddy's Labs, Zydus Lifesci., Abbott India, and Aurobindo Pharma, while good capital structure is found at Torrent Pharma and Lupin, and Glenmark Pharma has a good capital structure.<BR><BR>Return Snapshot: The peer with the highest 1-year return is Divi's Lab. at 49.58%, while the peer with the lowest is Zydus Lifesci. at -18.37%. Mankind Pharma's 1-year return of 23.90% is higher than Zydus Lifesci. but lower than Divi's Lab. Additionally, the peers with negative six-month returns include Sun Pharma.Inds., Dr Reddy's Labs, Zydus Lifesci., and Lupin.

View full answer

Who are in the management team of Mankind Pharma?

16-Jul-2025

As of March 2023, the management team of Mankind Pharma includes Ramesh Chand Juneja (Chairman), Rajeev Juneja (Vice Chairman & Managing Director), Sheetal Arora (CEO), and several independent directors, along with other key executives. Each member contributes to the company's governance and management.

As of March 2023, the management team of Mankind Pharma includes the following individuals:<BR><BR>1. Ramesh Chand Juneja - Chairman & Wholetime Director<BR>2. Rajeev Juneja - Vice Chairman & Managing Director<BR>3. Sheetal Arora - Whole Time Director & CEO<BR>4. Tilokchand Punamchand Ostwal - Independent Director<BR>5. Pradeep Chugh - Company Secretary & Compliance Officer<BR>6. Bharat Anand - Independent Director<BR>7. Satish Kumar Sharma - Whole-time Director<BR>8. Vivek Kalra - Independent Director<BR>9. Vijaya Sampath - Independent Director<BR><BR>Each member plays a significant role in the governance and management of the company.

View full answer

Who are the top shareholders of the Mankind Pharma?

17-Jul-2025

The top shareholder of Mankind Pharma is the Ramesh Juneja Family Trust, holding 20.2%. Promoters own the majority, with institutional investors holding 20.59% combined, while individual investors own about 1.64%.

The top shareholders of Mankind Pharma include the Ramesh Juneja Family Trust, which holds the largest stake at 20.2%. The company is primarily owned by its promoters, with no pledged promoter holdings reported. Additionally, institutional investors are involved, with 32 mutual fund schemes holding a combined 7.67% and 554 foreign institutional investors (FIIs) holding 12.92%. The highest public shareholder is the SBI Large & Midcap Fund, which holds 1.58%. Individual investors collectively own about 1.64% of the company.

View full answer

How big is Mankind Pharma?

24-Jul-2025

As of 24th July, Mankind Pharma Ltd has a market capitalization of 107,927.00 Cr, with recent net sales of 12,248.09 Cr and a net profit of 1,990.96 Cr. The company reported shareholder's funds of 14,332.39 Cr and total assets of 27,651.64 Cr as of March 2025.

As of 24th July, Mankind Pharma Ltd has a market capitalization of 107,927.00 Cr, categorizing it as a Large Cap company.<BR><BR>In the latest four quarters, Mankind Pharma reported Net Sales of 12,248.09 Cr and a Net Profit of 1,990.96 Cr.<BR><BR>For the reporting period of March 2025, the company had Shareholder's Funds amounting to 14,332.39 Cr and Total Assets of 27,651.64 Cr.

View full answer

Is Mankind Pharma overvalued or undervalued?

14-Oct-2025

As of October 13, 2025, Mankind Pharma is considered very expensive with a PE ratio of 53.30 and significant underperformance compared to peers and the Sensex, indicating it may be overvalued.

As of 13 October 2025, Mankind Pharma's valuation grade has moved from expensive to very expensive, indicating a significant shift in its market perception. The company appears to be overvalued based on key financial ratios, including a PE ratio of 53.30, an EV to EBITDA of 33.50, and a Price to Book Value of 7.06. These figures suggest that the stock is trading at a premium compared to its earnings and book value.<BR><BR>In comparison to its peers, Mankind Pharma's valuation stands out as particularly high; for instance, Sun Pharma has a PE ratio of 34.9, while Cipla is valued attractively with a PE of 23.43. The disparity in valuations raises concerns about Mankind's sustainability at these levels. Furthermore, the company's stock has underperformed against the Sensex, with a year-to-date return of -15.1% compared to the Sensex's gain of 5.36%. This underperformance further supports the conclusion that Mankind Pharma is currently overvalued.

View full answer

When is the next results date for Mankind Pharma?

28-Oct-2025

The next results date for Mankind Pharma is November 6, 2025.

The next results date for Mankind Pharma is scheduled for November 6, 2025.

View full answer

How has been the historical performance of Mankind Pharma?

19-Nov-2025

Mankind Pharma has shown consistent growth, with net sales increasing from INR 6,214.43 crore in March 2021 to INR 12,207.44 crore in March 2025, alongside rising profits and improved cash flow. Total assets surged from INR 6,323.62 crore to INR 27,651.64 crore during the same period.

Answer:<BR>The historical performance of Mankind Pharma shows a consistent growth trajectory in net sales and profits over the years.<BR><BR>Breakdown:<BR>Mankind Pharma's net sales have increased significantly from INR 6,214.43 crore in March 2021 to INR 12,207.44 crore in March 2025. This growth is reflected in the total operating income, which rose from INR 6,214.43 crore in March 2021 to INR 12,207.44 crore in March 2025. The total expenditure, excluding depreciation, also grew from INR 4,566.33 crore in March 2021 to INR 9,189.51 crore in March 2025, indicating rising operational costs. Operating profit (PBDIT) has shown a positive trend, climbing from INR 1,819.05 crore in March 2021 to INR 3,554.72 crore in March 2025. Profit before tax increased from INR 1,679.93 crore in March 2021 to INR 2,504.09 crore in March 2025, while profit after tax rose from INR 1,281.35 crore to INR 1,994.35 crore during the same period. The company's total assets surged from INR 6,323.62 crore in March 2021 to INR 27,651.64 crore in March 2025, with total liabilities also increasing from INR 6,323.62 crore to INR 8,483.03 crore. The cash flow from operating activities improved from INR 1,137 crore in March 2021 to INR 2,413 crore in March 2025, reflecting enhanced operational efficiency. Overall, Mankind Pharma has demonstrated robust growth in revenue and profitability, alongside a significant increase in assets and cash flow.

View full answer

Is Mankind Pharma technically bullish or bearish?

02-Dec-2025

As of December 1, 2025, the technical trend has shifted to a bearish stance, driven by bearish MACD and Bollinger Bands signals, despite a bullish weekly RSI, with the stock trading below its previous close and well off its 52-week high.

As of 1 December 2025, the technical trend has changed from mildly bearish to bearish. The current technical stance is bearish with moderate strength. Key indicators driving this stance include a bearish MACD on the weekly timeframe, bearish signals from Bollinger Bands on both weekly and monthly timeframes, and a bearish moving average on the daily timeframe. The weekly RSI is bullish, but this is overshadowed by the overall bearish trend in other indicators. The KST is mildly bearish, and there is no clear trend indicated by Dow Theory or OBV. Overall, the bearish sentiment is reinforced by the recent price action, with the stock trading below its previous close and significantly off its 52-week high.

View full answer

Are Mankind Pharma Ltd latest results good or bad?

04-Feb-2026

Mankind Pharma Ltd's latest results are concerning, showing an 11.52% year-on-year sales growth but a 3.52% sequential revenue decline, along with reduced operating margins and a significant drop in quarterly net profit. The high valuation relative to industry averages further complicates the outlook.

Mankind Pharma Ltd's latest results present a mixed picture, leaning towards the negative. While the company reported a year-on-year net sales growth of 11.52%, it experienced a sequential decline of 3.52% in revenue compared to the previous quarter. This marks the first quarterly revenue drop in recent periods, which raises concerns about its growth momentum.<BR><BR>Additionally, the operating margins have contracted from 27.67% to 25.77% year-on-year, indicating increasing pressure on profitability. The net profit of ₹408.75 crores reflects a 7.50% increase year-on-year but shows a significant decline of 20.09% compared to the previous quarter. This deterioration in profitability metrics, coupled with rising costs—particularly in employee expenses and interest—suggests that the company is facing operational challenges.<BR><BR>Moreover, Mankind Pharma's valuation at 50.88 times trailing earnings is substantially higher than the industry average of 32 times, making it increasingly difficult to justify given the flat financial trends and margin compression.<BR><BR>In summary, while there are some positive year-on-year growth figures, the sequential declines in revenue and profit, along with margin pressures and high valuation, indicate that the latest results are more concerning than favorable.

View full answer

Should I buy, sell or hold Mankind Pharma Ltd?

04-Feb-2026

Why is Mankind Pharma Ltd falling/rising?

18-Mar-2026

As of 17-Mar, Mankind Pharma Ltd's stock price is declining, currently at 2,067.45, reflecting a 1.17% decrease. The stock has underperformed its sector and is close to its 52-week low, with reduced investor interest and disappointing financial results contributing to the downward trend.

As of 17-Mar, Mankind Pharma Ltd's stock price is falling, currently at 2,067.45, which reflects a decrease of 24.45 (-1.17%). The stock has been on a downward trend, having lost 8.15% over the last four days. It is also trading below its 5-day, 20-day, 50-day, 100-day, and 200-day moving averages, indicating a consistent decline in price momentum.<BR><BR>In terms of performance relative to the market, Mankind Pharma has underperformed its sector by 1.78% today and has shown a negative return of 7.61% over the past week, while the benchmark Sensex has only declined by 2.73%. Additionally, the stock is close to its 52-week low, being just 2.22% away from the low of Rs 2014.85.<BR><BR>Investor participation has also decreased, with delivery volume dropping by 50.66% compared to the 5-day average, suggesting a lack of interest from investors. Furthermore, the company's recent financial results have not been favorable, with flat results reported in December and a decline in profits by 8.1% over the past year. This has contributed to a perception of the stock being overvalued, as it trades at a premium compared to its peers.<BR><BR>Overall, the combination of declining stock performance, reduced investor participation, and disappointing financial results has led to the current fall in Mankind Pharma Ltd's stock price.

View full answer

Why is Mankind Pharma Ltd falling/rising?

19-Mar-2026

As of 18-Mar, Mankind Pharma Ltd's stock price is rising to Rs 2,103.00, up 1.72% after a trend reversal. However, it has underperformed over the past week and year-to-date, indicating caution despite current gains.

As of 18-Mar, Mankind Pharma Ltd's stock price is rising, currently at Rs 2,103.00, reflecting an increase of Rs 35.55 or 1.72%. This upward movement comes after a trend reversal, as the stock has gained after four consecutive days of decline. Additionally, it has outperformed its sector by 1.45% today and reached an intraday high of Rs 2,129.5, which is a 3% increase.<BR><BR>Despite this positive movement, the stock has been underperforming in the longer term, with a decline of 6.26% over the past week and 4.25% year-to-date. It is also trading lower than its moving averages across various time frames, indicating a generally bearish trend. Furthermore, there has been a decrease in investor participation, with delivery volume falling by 16.59% against the five-day average.<BR><BR>On a positive note, the company exhibits strong management efficiency, a low debt-to-EBITDA ratio, and healthy long-term growth in net sales and operating profit. However, concerns remain regarding its flat results in December and an expensive valuation compared to peers, which may contribute to mixed investor sentiment. Overall, while the stock is currently rising, its longer-term performance and recent trends suggest caution.

View full answer

Why is Mankind Pharma Ltd falling/rising?

20-Mar-2026

As of 19-Mar, Mankind Pharma Ltd's stock price is at 2,001.25, down 4.81%, reflecting significant downward pressure with a new 52-week low and underperformance against its sector. The stock's struggles are compounded by declining investor interest and unfavorable market conditions, despite some positive long-term growth indicators.

As of 19-Mar, Mankind Pharma Ltd's stock price is falling, currently at 2,001.25, reflecting a decrease of 101.15 or 4.81%. This decline is evidenced by several factors. The stock has recently hit a new 52-week low of Rs.1995, indicating significant downward pressure. Additionally, it has underperformed its sector by 2.56% today and reached an intraday low of Rs.1995, marking a drop of 5.11%. <BR><BR>The stock's performance over various periods also highlights its struggles, with a 1-week decline of 9.38% and a year-to-date drop of 8.88%. Furthermore, Mankind Pharma is trading below its moving averages across multiple time frames, including the 5-day, 20-day, 50-day, 100-day, and 200-day averages, which typically signals a bearish trend.<BR><BR>Investor participation has also decreased, with delivery volume falling by 44.09% compared to the 5-day average, suggesting waning interest from traders. The overall performance of the Pharmaceuticals & Drugs sector has contributed to this decline, as it has fallen by 2.13%.<BR><BR>Despite some positive factors, such as high management efficiency and strong long-term growth in net sales and operating profit, the stock faces challenges due to flat results and a high valuation compared to peers. The company's return on capital employed (ROCE) has been low, and profits have decreased by 8.1% over the past year, further contributing to investor concerns. Overall, the combination of poor recent performance, declining investor interest, and unfavorable market conditions has led to the stock's current downward trajectory.

View full answer

Why is Mankind Pharma Ltd falling/rising?

21-Mar-2026

As of 20-Mar, Mankind Pharma Ltd's stock price is at 2,012.90, showing a slight increase but an overall downward trend with a 5.84% decline over the past week and an 8.35% decrease year-to-date. The stock has hit a new 52-week low and underperformed its sector, indicating ongoing challenges and cautious investor sentiment.

As of 20-Mar, Mankind Pharma Ltd's stock price is currently at 2,012.90, reflecting a change of 11.65 (0.58%) upward. Despite this slight increase, the stock has been experiencing a downward trend overall. Over the past week, it has fallen by 5.84%, and year-to-date, it has decreased by 8.35%. Additionally, the stock has hit a new 52-week low of Rs.1967.9 today, indicating ongoing challenges.<BR><BR>The performance today shows that Mankind Pharma underperformed its sector by 1.12%. It is also trading below its moving averages across various time frames, including the 5-day, 20-day, 50-day, 100-day, and 200-day averages, which typically suggests a bearish trend. <BR><BR>Investor participation has increased, with a delivery volume of 5.6 lacs on March 19, rising by 95.9% against the 5-day average, indicating some interest in the stock despite its overall decline. However, the company faces significant challenges, including flat results reported in December and a low Return on Capital Employed (ROCE) of 11.7, which contributes to its expensive valuation compared to peers.<BR><BR>Moreover, the stock has consistently underperformed against benchmarks over the last three years, with a return of -10.54% in the past year and a decline in profits by 8.1%. These factors collectively suggest that while there may be short-term fluctuations in price, the overall sentiment around Mankind Pharma Ltd remains cautious due to its historical underperformance and current financial metrics.

View full answer

Why is Mankind Pharma Ltd falling/rising?

25-Mar-2026

As of 24-Mar, Mankind Pharma Ltd's stock price is rising to Rs 2,006.00, up 4.35% after a trend reversal. Despite a year-to-date decline of 8.67%, strong fundamentals and increased investor participation may support its recent positive momentum.

As of 24-Mar, Mankind Pharma Ltd's stock price is rising, currently at Rs 2,006.00, reflecting an increase of Rs 83.55 or 4.35%. This upward movement follows a trend reversal after three consecutive days of decline. The stock has outperformed its sector by 3.23% today and reached an intraday high of Rs 2,006, indicating positive momentum.<BR><BR>Despite the recent rise, the stock has faced challenges, including a year-to-date decline of 8.67% and a 15.39% drop over the past year. It is also trading below its moving averages across various time frames, which typically suggests a bearish trend. However, the increase in delivery volume by 9.76% against the 5-day average indicates rising investor participation, which may contribute to the current price rise.<BR><BR>Additionally, the company demonstrates strong fundamentals, such as a high return on capital employed (ROCE) of 25.78% and a low debt to EBITDA ratio of 0.54, suggesting effective management and financial health. These factors, combined with high institutional holdings at 24.59%, may provide a supportive backdrop for the stock's recent performance.

View full answer

Why is Mankind Pharma Ltd falling/rising?

26-Mar-2026

As of 25-Mar, Mankind Pharma Ltd's stock price is rising to 2,031.00, reflecting a 2.2% increase. This rise is supported by strong fundamentals, increased investor participation, and positive market sentiment, despite a year-long underperformance of -15.32%.

As of 25-Mar, Mankind Pharma Ltd's stock price is rising, currently at 2,031.00, reflecting an increase of 43.75 (2.2%). This upward movement can be attributed to several factors. Firstly, the stock has been gaining for the last two days, with a total return of 5.65% during this period. Additionally, it outperformed its sector by 0.31% today, indicating positive market sentiment towards the stock.<BR><BR>The stock reached an intraday high of Rs 2038.5, which is a 2.58% increase, showcasing strong trading activity. There has also been a rise in investor participation, with delivery volume increasing by 1.99% compared to the five-day average. This suggests that more investors are willing to hold the stock, which can contribute to upward price pressure.<BR><BR>Moreover, Mankind Pharma Ltd exhibits strong fundamentals, including a high Return on Capital Employed (ROCE) of 25.78% and a low Debt to EBITDA ratio of 0.54 times, indicating efficient management and a solid ability to service debt. The company has also demonstrated healthy long-term growth, with net sales growing at an annual rate of 18.21% and operating profit at 18.72%. High institutional holdings at 24.59% further support the stock's stability, as institutional investors typically have better resources for analyzing company fundamentals.<BR><BR>Despite these positive indicators, it is important to note that the stock has underperformed over the past year, with a return of -15.32%. However, the recent performance and strong fundamentals suggest that the current rise in stock price may reflect a recovery or correction phase in response to the company's overall financial health and market conditions.

View full answer
iScoreScore
Click here to find our call on this stock
Strong Sell
Sell
Hold
Buy
Strong Buy

Dashboard

1

Flat results in Dec 25

  • ROCE(HY) Lowest at 12.33%
  • DEBTORS TURNOVER RATIO(HY) Lowest at 7.13 times
2

With ROCE of 11.7, it has a Expensive valuation with a 4.3 Enterprise value to Capital Employed

3

Underperformed the market in the last 1 year

stock-summaryMojo Parameters

Mojo Parameters

Loading Valuation Snapshot...

Stock DNA

stock-summary
Industry

Pharmaceuticals & Biotechnology

stock-summary
Market cap

INR 83,127 Cr (Mid Cap)

stock-summary
P/E

45.00

stock-summary
Industry P/E

32

stock-summary
Dividend Yield

0.05%

stock-summary
Debt Equity

0.34

stock-summary
Return on Equity

11.44%

stock-summary
Price to Book

5.42

Revenue and Profits:
Net Sales:
3,567 Cr
(Quarterly Results - Dec 2025)
Net Profit:
409 Cr
stock-summaryTotal Returns
Total Returns (Price + Dividend) stock-summary
Dividend Yield (0.05%)
TimePeriod
Price Return
Dividend Return
Total Return
3 Months
-7.72%
0%
-7.72%
6 Months
-19.88%
0%
-19.88%
1 Year
-15.6%
0.04%
-15.56%
2 Years
-8.58%
0.04%
-8.54%
3 Years
0%
0%
0.0%
4 Years
0%
0%
0.0%
5 Years
0%
0%
0.0%

Latest dividend: 1 per share ex-dividend date: Aug-08-2025

Risk Adjusted Returns v/s stock-summary
Returns Beta
Icon
Beta has not been calculated since enough price history is not available
stock-summaryNews & Corporate Actions

News

Why is Mankind Pharma Ltd falling/rising?

Recent Price Movement and Market Context

The stock has been under pressure for several sessions, recording a consecutive three-day fall that has resulted in an 8.56% loss over this period. On the day in question, the share price hit a new 52-week low of ₹1,909.9, marking a 4.49% intraday decline. This underperformance is slightly worse than the Pharmaceuticals & Drugs sector, which itself fell by 3.62%, indicating sector-wide weakness but with Mankind Pharma lagging marginally behind.

Trading volumes have increased, with delivery volumes on 20 Mar rising by 83.22% compared to the five-day average, suggesting heightened investor activity. However, the weighted average price indicates that more shares were traded closer to the day’s low, signalling selling pressure. ...

Read full news article
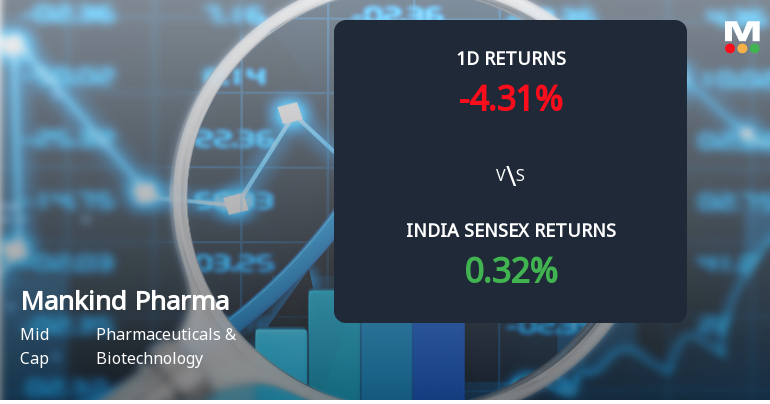
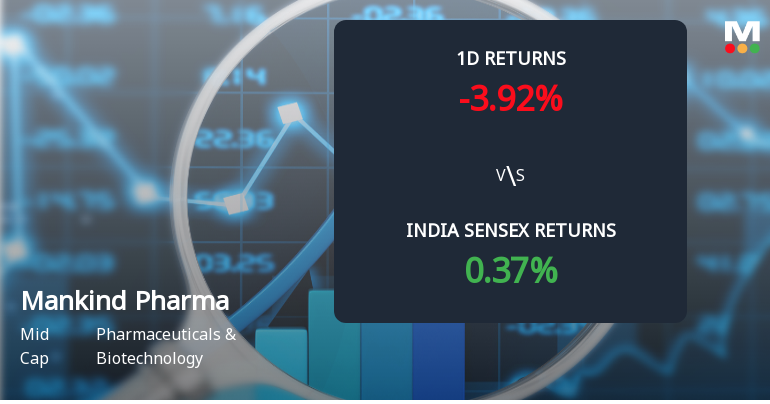
Announcements stock-summary

Icon
No announcement available

Corporate Actions stock-summary

stock-summary
BOARD MEETING

No Upcoming Board Meetings

stock-summary
DIVIDEND

Mankind Pharma Ltd has declared 100% dividend, ex-date: 08 Aug 25

stock-summary
SPLITS

No Splits history available

stock-summary
BONUS

No Bonus history available

stock-summary
RIGHTS

No Rights history available

stock-summaryKey Factors

Quality key factors stock-summary

Factor
Value
Sales Growth (5y)
18.21%
EBIT Growth (5y)
18.72%
EBIT to Interest (avg)
27.33
Debt to EBITDA (avg)
1.27
Net Debt to Equity (avg)
0.34
Sales to Capital Employed (avg)
0.81
Tax Ratio
17.42%
Dividend Payout Ratio
0
Pledged Shares
0
Institutional Holding
24.59%
ROCE (avg)
21.63%
ROE (avg)
16.64%

Valuation key factors

Factor
Value
P/E Ratio
45
Industry P/E
32
Price to Book Value
5.49
EV to EBIT
35.98
EV to EBITDA
26.44
EV to Capital Employed
4.34
EV to Sales
6.40
PEG Ratio
NA
Dividend Yield
0.05%
ROCE (Latest)
11.72%
ROE (Latest)
11.44%

Technicals key factors

Indicator
Weekly
Monthly
MACD
Mildly Bullish
Mildly Bearish
RSI
No Signal
No Signal
Bollinger Bands
Mildly Bearish
Bearish
Moving Averages
Bearish (Daily)
KST
Mildly Bearish
Dow Theory
Mildly Bearish
Mildly Bearish
OBV
Mildly Bearish
Mildly Bearish
stock-summary Technical Indicator Scale: Bearish, Mildly Bearish, Sideways, Mildly Bullish, Bullish  Turned 
stock-summaryShareholding
Shareholding Snapshot : Dec 2025stock-summary
Shareholding Compare (%holding) stock-summary
Majority shareholders

Promoters

Pledged Promoter Holdings

None

Mutual Funds

Held by 31 Schemes (9.3%)

FIIs

Held by 510 FIIs (11.34%)

Promoter with highest holding

Ramesh Juneja Family Trust (held In The Name Of Ramesh Juneja, Managing Trustee) (20.19%)

Highest Public shareholder

Nps Trust A/c - Lic Pension Fund - Ups - Cg Scheme (2.61%)

Individual Investors Holdings

1.52%

stock-summaryFinancial
[
  {
    "link": "quarterly",
    "btn_text": "All Quarterly Results",
    "header": "Quarterly Results Snapshot (Consolidated) - Dec'25 - QoQ",
    "rhs": [
      {
        "prefix": "Net Sales ",
        "suffix": "QoQ Growth in quarter ended Dec 2025 is -3.52% vs 3.55% in Sep 2025",
        "dir": -1
      },
      {
        "prefix": "Consolidated Net Profit ",
        "suffix": "QoQ Growth in quarter ended Dec 2025 is -20.09% vs 16.70% in Sep 2025",
        "dir": -1
      }
    ],
    "table": {
      "header": [
        "Dec'25",
        "Sep'25",
        "Change(%)"
      ],
      "body": [
        {
          "field": "Net Sales",
          "val1": "3,567.20",
          "val2": "3,697.16",
          "chgp": "-3.52%",
          "chgp_class": "negative"
        },
        {
          "field": "Operating Profit (PBDIT) excl Other Income",
          "val1": "919.43",
          "val2": "921.33",
          "chgp": "-0.21%",
          "chgp_class": "negative"
        },
        {
          "field": "Interest",
          "val1": "157.20",
          "val2": "169.68",
          "chgp": "-7.36%",
          "chgp_class": "positive"
        },
        {
          "field": "Exceptional Items",
          "val1": "-106.59",
          "val2": "0.00",
          "chgp": "",
          "chgp_class": "neutral"
        },
        {
          "field": "Consolidate Net Profit",
          "val1": "408.75",
          "val2": "511.51",
          "chgp": "-20.09%",
          "chgp_class": "negative"
        },
        {
          "field": "Operating Profit Margin (Excl OI)",
          "val1": "25.77%",
          "val2": "24.92%",
          "chgp": "0.85%",
          "chgp_class": "positive"
        }
      ]
    }
  },
  {
    "link": "half-yearly",
    "btn_text": "All Half Yearly Results",
    "header": "Half Yearly Results Snapshot (Consolidated) - Sep'25",
    "rhs": [
      {
        "prefix": "Net Sales ",
        "suffix": " Growth in half year ended Sep 2025 is 22.57% vs 12.15% in Sep 2024",
        "dir": 1
      },
      {
        "prefix": "Consolidated Net Profit ",
        "suffix": " Growth in half year ended Sep 2025 is -20.18% vs 20.45% in Sep 2024",
        "dir": -1
      }
    ],
    "table": {
      "header": [
        "Sep'25",
        "Sep'24",
        "Change(%)"
      ],
      "body": [
        {
          "field": "Net Sales",
          "val1": "7,267.51",
          "val2": "5,929.28",
          "chgp": "22.57%",
          "chgp_class": "positive"
        },
        {
          "field": "Operating Profit (PBDIT) excl Other Income",
          "val1": "1,768.10",
          "val2": "1,518.75",
          "chgp": "16.42%",
          "chgp_class": "positive"
        },
        {
          "field": "Interest",
          "val1": "340.33",
          "val2": "17.94",
          "chgp": "1,797.05%",
          "chgp_class": "negative"
        },
        {
          "field": "Exceptional Items",
          "val1": "0.00",
          "val2": "2.22",
          "chgp": "-100.00%",
          "chgp_class": "negative"
        },
        {
          "field": "Consolidate Net Profit",
          "val1": "949.83",
          "val2": "1,189.96",
          "chgp": "-20.18%",
          "chgp_class": "negative"
        },
        {
          "field": "Operating Profit Margin (Excl OI)",
          "val1": "24.33%",
          "val2": "25.61%",
          "chgp": "-1.28%",
          "chgp_class": "negative"
        }
      ]
    }
  },
  {
    "link": "nine-monthly",
    "btn_text": "All Nine Monthly Results",
    "header": "Nine Monthly Results Snapshot (Consolidated) - Dec'25",
    "rhs": [
      {
        "prefix": "Net Sales ",
        "suffix": "YoY Growth in nine months ended Dec 2025 is 18.70% vs 15.64% in Dec 2024",
        "dir": 1
      },
      {
        "prefix": "Consolidated Net Profit ",
        "suffix": "YoY Growth in nine months ended Dec 2025 is -13.48% vs 8.92% in Dec 2024",
        "dir": -1
      }
    ],
    "table": {
      "header": [
        "Dec'25",
        "Dec'24",
        "Change(%)"
      ],
      "body": [
        {
          "field": "Net Sales",
          "val1": "10,834.71",
          "val2": "9,128.07",
          "chgp": "18.70%",
          "chgp_class": "positive"
        },
        {
          "field": "Operating Profit (PBDIT) excl Other Income",
          "val1": "2,687.53",
          "val2": "2,334.74",
          "chgp": "15.11%",
          "chgp_class": "positive"
        },
        {
          "field": "Interest",
          "val1": "497.53",
          "val2": "238.87",
          "chgp": "108.28%",
          "chgp_class": "negative"
        },
        {
          "field": "Exceptional Items",
          "val1": "-106.59",
          "val2": "8.87",
          "chgp": "-1,301.69%",
          "chgp_class": "negative"
        },
        {
          "field": "Consolidate Net Profit",
          "val1": "1,358.58",
          "val2": "1,570.19",
          "chgp": "-13.48%",
          "chgp_class": "negative"
        },
        {
          "field": "Operating Profit Margin (Excl OI)",
          "val1": "24.80%",
          "val2": "25.58%",
          "chgp": "-0.78%",
          "chgp_class": "negative"
        }
      ]
    }
  },
  {
    "link": "annual",
    "btn_text": "All Annual Results",
    "header": "Annual Results Snapshot (Consolidated) - Mar'25",
    "rhs": [
      {
        "prefix": "Net Sales ",
        "suffix": "YoY Growth in year ended Mar 2025 is 18.98% vs 17.27% in Mar 2024",
        "dir": 1
      },
      {
        "prefix": "Consolidated Net Profit ",
        "suffix": "YoY Growth in year ended Mar 2025 is 4.08% vs 49.23% in Mar 2024",
        "dir": -1
      }
    ],
    "table": {
      "header": [
        "Mar'25",
        "Mar'24",
        "Change(%)"
      ],
      "body": [
        {
          "field": "Net Sales",
          "val1": "12,207.44",
          "val2": "10,260.44",
          "chgp": "18.98%",
          "chgp_class": "positive"
        },
        {
          "field": "Operating Profit (PBDIT) excl Other Income",
          "val1": "3,017.93",
          "val2": "2,513.68",
          "chgp": "20.06%",
          "chgp_class": "positive"
        },
        {
          "field": "Interest",
          "val1": "429.41",
          "val2": "32.75",
          "chgp": "1,211.18%",
          "chgp_class": "negative"
        },
        {
          "field": "Exceptional Items",
          "val1": "4.53",
          "val2": "0.98",
          "chgp": "362.24%",
          "chgp_class": "positive"
        },
        {
          "field": "Consolidate Net Profit",
          "val1": "1,990.96",
          "val2": "1,912.90",
          "chgp": "4.08%",
          "chgp_class": "positive"
        },
        {
          "field": "Operating Profit Margin (Excl OI)",
          "val1": "24.72%",
          "val2": "24.50%",
          "chgp": "0.22%",
          "chgp_class": "positive"
        }
      ]
    }
  }
]

Quarterly Results Snapshot (Consolidated) - Dec'25 - QoQstock-summary

Dec'25
Sep'25
Change(%)
Net Sales
3,567.20
3,697.16
-3.52%
Operating Profit (PBDIT) excl Other Income
919.43
921.33
-0.21%
Interest
157.20
169.68
-7.36%
Exceptional Items
-106.59
0.00
Consolidate Net Profit
408.75
511.51
-20.09%
Operating Profit Margin (Excl OI)
25.77%
24.92%
0.85%
Values in Rs Cr.
Direction Arrows
Net Sales

QoQ Growth in quarter ended Dec 2025 is -3.52% vs 3.55% in Sep 2025

Direction Arrows
Consolidated Net Profit

QoQ Growth in quarter ended Dec 2025 is -20.09% vs 16.70% in Sep 2025

Half Yearly Results Snapshot (Consolidated) - Sep'25stock-summary

Sep'25
Sep'24
Change(%)
Net Sales
7,267.51
5,929.28
22.57%
Operating Profit (PBDIT) excl Other Income
1,768.10
1,518.75
16.42%
Interest
340.33
17.94
1,797.05%
Exceptional Items
0.00
2.22
-100.00%
Consolidate Net Profit
949.83
1,189.96
-20.18%
Operating Profit Margin (Excl OI)
24.33%
25.61%
-1.28%
Values in Rs Cr.
Direction Arrows
Net Sales

Growth in half year ended Sep 2025 is 22.57% vs 12.15% in Sep 2024

Direction Arrows
Consolidated Net Profit

Growth in half year ended Sep 2025 is -20.18% vs 20.45% in Sep 2024

Nine Monthly Results Snapshot (Consolidated) - Dec'25stock-summary

Dec'25
Dec'24
Change(%)
Net Sales
10,834.71
9,128.07
18.70%
Operating Profit (PBDIT) excl Other Income
2,687.53
2,334.74
15.11%
Interest
497.53
238.87
108.28%
Exceptional Items
-106.59
8.87
-1,301.69%
Consolidate Net Profit
1,358.58
1,570.19
-13.48%
Operating Profit Margin (Excl OI)
24.80%
25.58%
-0.78%
Values in Rs Cr.
Direction Arrows
Net Sales

YoY Growth in nine months ended Dec 2025 is 18.70% vs 15.64% in Dec 2024

Direction Arrows
Consolidated Net Profit

YoY Growth in nine months ended Dec 2025 is -13.48% vs 8.92% in Dec 2024

Annual Results Snapshot (Consolidated) - Mar'25stock-summary

Mar'25
Mar'24
Change(%)
Net Sales
12,207.44
10,260.44
18.98%
Operating Profit (PBDIT) excl Other Income
3,017.93
2,513.68
20.06%
Interest
429.41
32.75
1,211.18%
Exceptional Items
4.53
0.98
362.24%
Consolidate Net Profit
1,990.96
1,912.90
4.08%
Operating Profit Margin (Excl OI)
24.72%
24.50%
0.22%
Values in Rs Cr.
Direction Arrows
Net Sales

YoY Growth in year ended Mar 2025 is 18.98% vs 17.27% in Mar 2024

Direction Arrows
Consolidated Net Profit

YoY Growth in year ended Mar 2025 is 4.08% vs 49.23% in Mar 2024

stock-summaryCompany CV
About Mankind Pharma Ltd stock-summary
stock-summary
Mankind Pharma Ltd
Mid Cap
Pharmaceuticals & Biotechnology
Mankind Pharma Limited was incorporated on July 3, 1991, as a Private Limited Company with the name "Mankind Pharma Private Limited", by the Registrar of Companies, Delhi and Haryana, at New Delhi. Pursuant to conversion of Company to a Public Limited dated July 14, 2005, name of the Company was changed to "Mankind Pharma Limited" and the RoC issued a fresh Certificate of Incorporation on April 13, 2006.
Company Coordinates stock-summary
Icon
No Company Details Available