
Compare Mankind Pharma with Similar Stocks
Dashboard
High Management Efficiency with a high ROCE of 20.79%
Strong ability to service debt as the company has a low Debt to EBITDA ratio of 1.74 times
Healthy long term growth as Operating profit has grown by an annual rate 20.15%
Positive results in Mar 26
High Institutional Holdings at 24.7%
Market Beating performance in long term as well as near term
Stock DNA
Pharmaceuticals & Biotechnology
INR 105,520 Cr (Mid Cap)
51.00
35
0.04%
0.26
12.39%
6.41
Total Returns (Price + Dividend) 
Latest dividend: 1 per share ex-dividend date: Aug-08-2025
Risk Adjusted Returns v/s
Returns Beta

News

Mankind Pharma Sees Sharp Open Interest Surge Amid Mixed Price Action
Mankind Pharma Ltd has witnessed a notable 12.17% increase in open interest in its derivatives segment, signalling heightened market activity despite the stock underperforming its sector and broader indices. This surge in open interest, coupled with rising volumes and shifting investor positioning, offers important clues about potential directional bets and market sentiment for this mid-cap pharmaceutical player.
Read full news article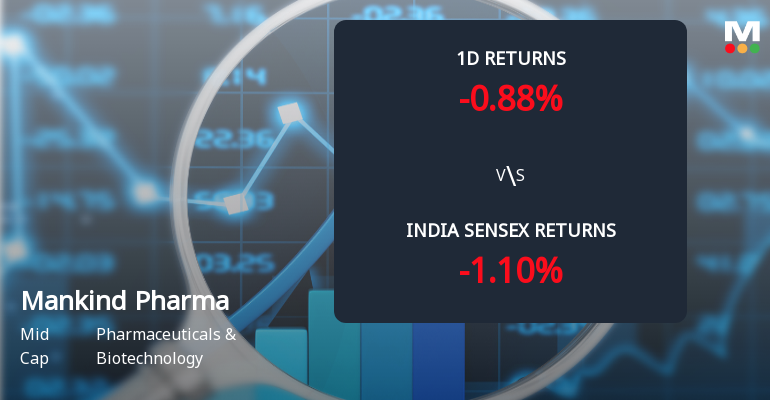
Mankind Pharma Sees Sharp Open Interest Surge Amid Mixed Market Signals
Mankind Pharma Ltd has witnessed a notable 15.11% increase in open interest in its derivatives segment, signalling heightened market activity and shifting investor positioning. Despite this surge, the stock underperformed its sector and the broader Sensex, reflecting a complex interplay between bullish bets and short-term profit-taking.
Read full news article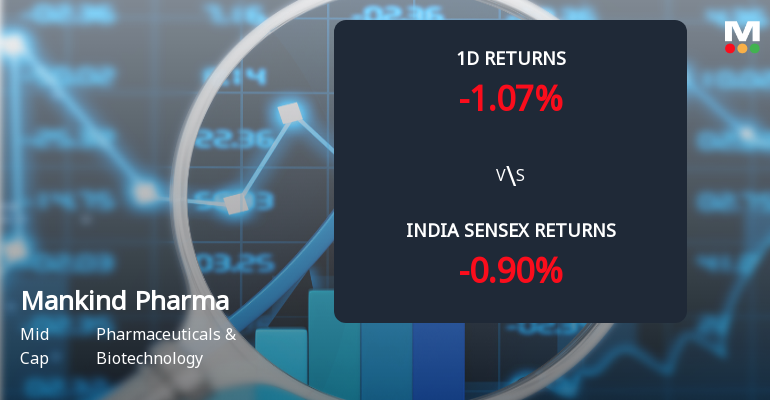
Mankind Pharma Sees Significant Open Interest Surge Amid Mixed Market Signals
Mankind Pharma Ltd, a mid-cap player in the Pharmaceuticals & Biotechnology sector, has witnessed a notable 16.23% surge in open interest (OI) in its derivatives segment, signalling heightened market activity and evolving investor positioning. Despite a slight price dip of 0.72% on 23 Jun 2026, the stock’s underlying metrics and trading volumes suggest a complex interplay of bullish and bearish bets among market participants.
Read full news article Announcements
Announcement under Regulation 30 (LODR)-Analyst / Investor Meet - Intimation
15-Jun-2026 | Source : BSEPlease find attached intimation regarding participation in investor conference by management and officials of the Company
Announcement under Regulation 30 (LODR)-Change in Management
08-Jun-2026 | Source : BSEPlease find attached Intimation regarding Change in Management.
Announcement under Regulation 30 (LODR)-Allotment of ESOP / ESPS
08-Jun-2026 | Source : BSEAllotment of 86778 Equity Shares under Mankind Employee Stock Option Plan 2022 (ESOP PLAN)
Corporate Actions

No Upcoming Board Meetings

Mankind Pharma Ltd has declared 100% dividend, ex-date: 08 Aug 25

No Splits history available

No Bonus history available

No Rights history available
Quality key factors
Valuation key factors
Technicals key factors
 Technical Indicator Scale: Bearish, Mildly Bearish, Sideways, Mildly Bullish, Bullish Turned
 Shareholding Snapshot : Mar 2026
Shareholding Compare (%holding)
Promoters
None
Held by 31 Schemes (10.36%)
Held by 504 FIIs (10.24%)
Ramesh Juneja Family Trust (held In The Name Of Ramesh Juneja, Managing Trustee) (20.19%)
Nps Trust- A/c Sbi Pension Fund Pvt Ltd Apy Fund S (2.77%)
1.39%
Quarterly Results Snapshot (Consolidated) - Mar'26 - QoQ

QoQ Growth in quarter ended Mar 2026 is -3.48% vs -3.52% in Dec 2025
QoQ Growth in quarter ended Mar 2026 is 35.62% vs -20.09% in Dec 2025
Half Yearly Results Snapshot (Consolidated) - Sep'25
Growth in half year ended Sep 2025 is 22.57% vs 12.15% in Sep 2024

Growth in half year ended Sep 2025 is -20.18% vs 20.45% in Sep 2024
Nine Monthly Results Snapshot (Consolidated) - Dec'25
YoY Growth in nine months ended Dec 2025 is 18.70% vs 15.64% in Dec 2024
YoY Growth in nine months ended Dec 2025 is -13.48% vs 8.92% in Dec 2024
Annual Results Snapshot (Consolidated) - Mar'26
YoY Growth in year ended Mar 2026 is 16.96% vs 18.98% in Mar 2025
YoY Growth in year ended Mar 2026 is -3.92% vs 4.08% in Mar 2025
About Mankind Pharma Ltd

Company Coordinates


