
Compare Manoj Vaibhav with Similar Stocks
Dashboard
Poor long term growth as Net Sales has grown by an annual rate of 12.98% and Operating profit at 11.30% over the last 5 years
Flat results in Mar 26
Despite the size of the company, domestic mutual funds hold only 0% of the company
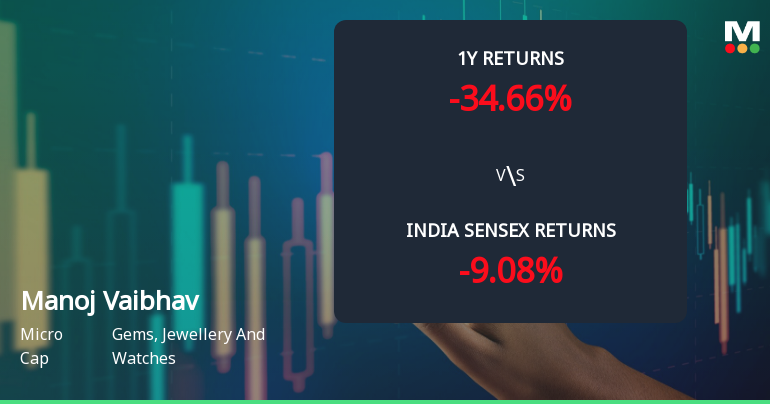
Below par performance in long term as well as near term
Stock DNA
Gems, Jewellery And Watches
INR 756 Cr (Micro Cap)
6.00
45
0.00%
0.51
15.06%
0.98
Total Returns (Price + Dividend) 
Manoj Vaibhav for the last several years.
Risk Adjusted Returns v/s
Returns Beta

News
Manoj Vaibhav Gems N Jewellers Ltd Technical Momentum Shifts Amid Market Challenges
Manoj Vaibhav Gems N Jewellers Ltd, a micro-cap player in the Gems, Jewellery and Watches sector, has experienced a subtle shift in its technical momentum, moving from a bearish to a mildly bearish trend. Despite a modest daily price increase of 1.04%, the stock continues to face headwinds from longer-term technical indicators and underperformance relative to benchmark indices.
Read full news article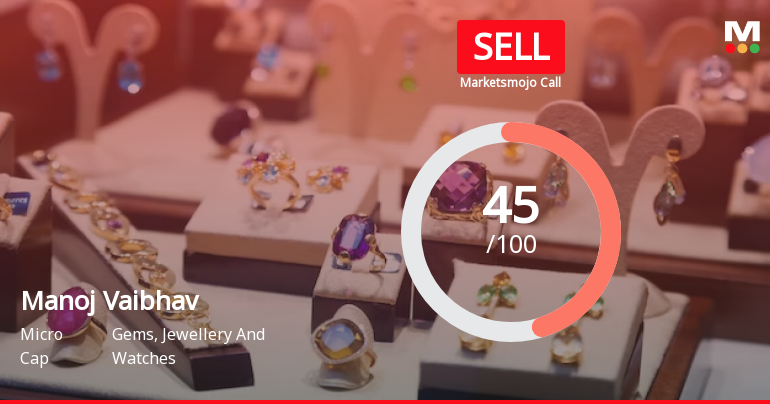
Manoj Vaibhav Gems N Jewellers Ltd is Rated Sell
Manoj Vaibhav Gems N Jewellers Ltd is rated Sell by MarketsMOJO, with this rating last updated on 22 May 2026. However, the analysis and financial metrics discussed here reflect the company’s current position as of 27 May 2026, providing investors with the latest insights into the stock’s fundamentals, valuation, financial trend, and technical outlook.
Read full news article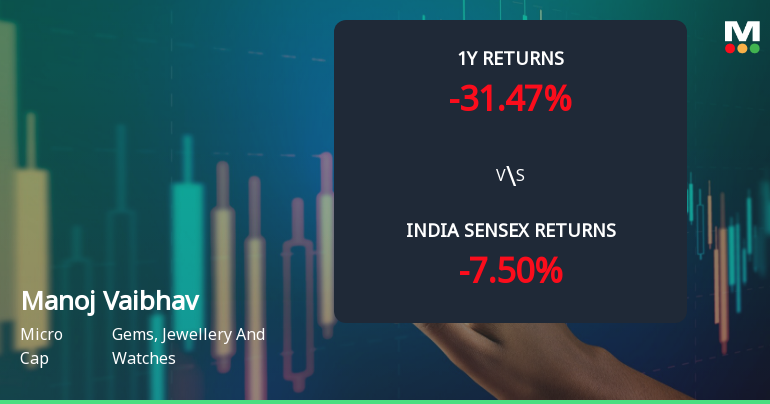
Manoj Vaibhav Gems N Jewellers Ltd Faces Bearish Technical Shift Amid Market Challenges
Manoj Vaibhav Gems N Jewellers Ltd has experienced a notable shift in its technical momentum, with key indicators signalling a bearish trend. Despite a modest intraday price gain of 1.97% to ₹155.45, the stock’s broader technical landscape reveals increasing downside risks amid deteriorating momentum and weakening relative strength.
Read full news article Announcements
Corporate Actions

No Upcoming Board Meetings

No Dividend history available

No Splits history available

No Bonus history available

No Rights history available
Quality key factors
Valuation key factors
Technicals key factors
 Technical Indicator Scale: Bearish, Mildly Bearish, Sideways, Mildly Bullish, Bullish Turned
 Shareholding Snapshot : Mar 2026
Shareholding Compare (%holding)
Promoters
None
Held by 0 Schemes
Held by 1 FIIs (0.6%)
Grandhi Bharata Mallika Ratna Kumari Huf(bharata Mallika Ratna Kumari Grandhi) (54.35%)
Collate Dealers Private Limited (1.65%)
17.6%
Quarterly Results Snapshot (Standalone) - Mar'26 - QoQ

QoQ Growth in quarter ended Mar 2026 is 10.17% vs -9.40% in Dec 2025

QoQ Growth in quarter ended Mar 2026 is -18.38% vs 8.73% in Dec 2025
Half Yearly Results Snapshot (Standalone) - Sep'25
Growth in half year ended Sep 2025 is 10.45% vs 4.71% in Sep 2024
Growth in half year ended Sep 2025 is 8.03% vs 16.98% in Sep 2024
Nine Monthly Results Snapshot (Standalone) - Dec'25
YoY Growth in nine months ended Dec 2025 is 18.50% vs 4.72% in Dec 2024
YoY Growth in nine months ended Dec 2025 is 17.83% vs 22.07% in Dec 2024
Annual Results Snapshot (Standalone) - Mar'26
YoY Growth in year ended Mar 2026 is 15.10% vs 10.90% in Mar 2025
YoY Growth in year ended Mar 2026 is 14.49% vs 24.09% in Mar 2025
About Manoj Vaibhav Gems N Jewellers Ltd

Company Coordinates


