
Compare Manraj Hsg.Fin. with Similar Stocks
Stock DNA
Housing Finance Company
INR 22 Cr (Micro Cap)
NA (Loss Making)
21
0.00%
-19.93
47.00%
-21.75
Total Returns (Price + Dividend) 
Manraj Hsg.Fin. for the last several years.
Risk Adjusted Returns v/s
Returns Beta

News
Are Manraj Housing Finance Ltd latest results good or bad?
Manraj Housing Finance Ltd's latest financial results indicate a challenging operational landscape. For the quarter ending September 2025, the company reported zero net sales, maintaining a trend of no revenue generation across recent periods. The net loss for this quarter was ₹0.04 crores, consistent with losses seen in previous quarters, and reflecting a slight improvement from the ₹0.34 crores loss in the preceding quarter. However, this marginal change does not signify a recovery, as the company continues to face significant operational stagnation. The company's financial position is further underscored by a negative book value per share of ₹0.54, indicating that liabilities exceed assets, which raises serious concerns about its solvency. Current liabilities remain high at ₹19.82 crores, while current assets are negligible at ₹0.09 crores, highlighting a severe liquidity issue. The absence of any meani...
Read full news articleWhen is the next results date for Manraj Housing Finance Ltd?
The next results date for Manraj Housing Finance Ltd is scheduled for 25 May 2026....
Read full news article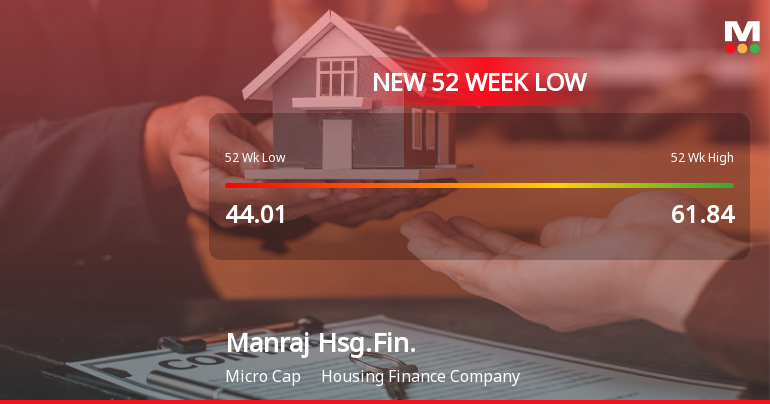
Manraj Housing Finance Ltd Falls to 52-Week Low of Rs 31.4 as Sell-Off Deepens
For the second consecutive session, Manraj Housing Finance Ltd has seen its share price decline, hitting a fresh 52-week low of Rs 31.4 on 23 Apr 2026. This latest drop extends the stock’s downward trajectory, which has now resulted in a 7.86% loss over the past two days, underscoring persistent selling pressure despite broader market fluctuations.
Read full news article Announcements
Closure of Trading Window
24-Jun-2026 | Source : BSEIntimation of Closure of Trading Window in term of SEBI ( Prohibtion of Insider Trading) Regulation 2015. The Trading Window for Dealing in Securities shall be closed with effect from 01st July 2026 for the designated person and their immediate relatives till Forty-Eight hours after decleration of Unaudited Financial Result for the Quarter ended 30th June 2026.
Submission Of Audited Financial Results For The Quarter And Year Ended On 31St March 2026
06-Jun-2026 | Source : BSESubmission of audited financial results for the quarter and year ended on 31st March 2026
Announcement under Regulation 30 (LODR)-Newspaper Publication
27-May-2026 | Source : BSESubmission of newpaper publication of the audited financial results for the quarter and year ended on 31st March 2026 published in newspaper dated 27th May 2026.
Corporate Actions

No Upcoming Board Meetings

No Dividend history available

No Splits history available

No Bonus history available

No Rights history available
Quality key factors
Valuation key factors
Technicals key factors
 Technical Indicator Scale: Bearish, Mildly Bearish, Sideways, Mildly Bullish, Bullish Turned
 Shareholding Snapshot : Mar 2026
Shareholding Compare (%holding)
Promoters
None
Held by 0 Schemes
Held by 0 FIIs
Ishwarlal S Jain (12.91%)
Pukhraj Prithviraj Jain (4.7%)
29.94%
Quarterly Results Snapshot (Standalone) - Mar'26 - QoQ
QoQ Growth in quarter ended Mar 2026 is 0.00% vs 0.00% in Dec 2025

QoQ Growth in quarter ended Mar 2026 is 20.00% vs -25.00% in Dec 2025
Half Yearly Results Snapshot (Standalone) - Sep'25
Growth in half year ended Sep 2025 is 0.00% vs 0.00% in Sep 2024

Growth in half year ended Sep 2025 is -192.86% vs 940.00% in Sep 2024
Nine Monthly Results Snapshot (Standalone) - Dec'25
YoY Growth in nine months ended Dec 2025 is 0.00% vs 0.00% in Dec 2024
YoY Growth in nine months ended Dec 2025 is -215.79% vs 642.86% in Dec 2024
Annual Results Snapshot (Standalone) - Mar'26
YoY Growth in year ended Mar 2026 is 0.00% vs 0.00% in Mar 2025
YoY Growth in year ended Mar 2026 is -241.18% vs 409.09% in Mar 2025
About Manraj Housing Finance Ltd


