
Compare Mansi Fin.(Chen) with Similar Stocks
Stock DNA
Non Banking Financial Company (NBFC)
INR 21 Cr (Micro Cap)
7.00
9
0.00%
0.47
8.01%
0.52
Total Returns (Price + Dividend) 
Mansi Fin.(Chen) for the last several years.
Risk Adjusted Returns v/s
Returns Beta

News
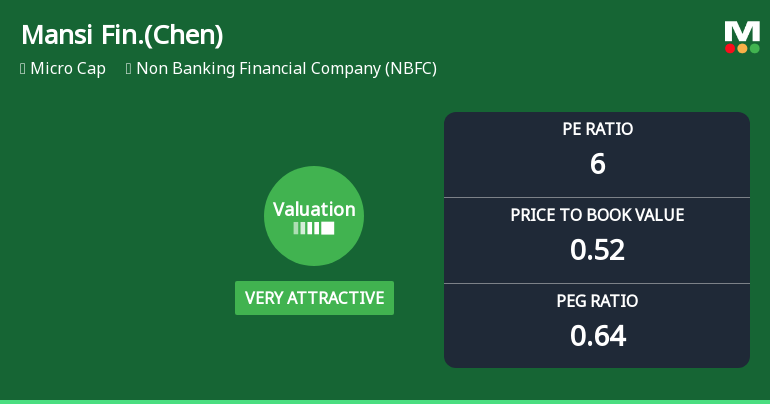
Mansi Finance (Chennai) Ltd Valuation Turns Very Attractive Amid Market Pressure
Mansi Finance (Chennai) Ltd has witnessed a significant shift in its valuation parameters, moving from an attractive to a very attractive price range, driven primarily by its low price-to-earnings (P/E) and price-to-book value (P/BV) ratios. Despite recent share price declines, the company’s valuation metrics now stand out favourably against peers and historical averages, presenting a compelling case for investors seeking value in the NBFC sector.
Read full news articleAre Mansi Finance (Chennai) Ltd latest results good or bad?
Mansi Finance (Chennai) Ltd's latest financial results for Q4 FY26 reveal significant operational challenges. The company reported a net loss of ₹0.50 crores, marking a stark contrast to the profitability seen in previous quarters. Revenue for the quarter was ₹1.67 crores, reflecting a substantial year-on-year decline of 64.32% from ₹4.68 crores in Q4 FY25. This decline in revenue has been consistent over the past four quarters, indicating a troubling trend for the company's core operations. The operating profit before depreciation, interest, and tax (PBDIT) fell sharply to ₹0.40 crores, resulting in an operating margin of 23.95%, down from 69.86% in the previous quarter. This volatility in operating margins raises concerns about the sustainability of the company's earnings. Additionally, the profit after tax (PAT) margin turned negative at -29.94%, a significant drop from the positive margin of 40.19% jus...
Read full news article
Mansi Finance (Chennai) Ltd: Valuation Shifts Signal Price Attractiveness Amid Market Pressure
Mansi Finance (Chennai) Ltd, a micro-cap player in the Non Banking Financial Company (NBFC) sector, has witnessed a notable shift in its valuation parameters, moving from a very attractive to an attractive valuation grade. Despite a recent 5.00% drop in its share price to ₹61.75, the company’s price-to-earnings (P/E) and price-to-book value (P/BV) ratios suggest a compelling investment case relative to its peers and historical benchmarks.
Read full news article Announcements
Announcement under Regulation 30 (LODR)-Newspaper Publication
03-Jun-2026 | Source : BSEThe copy of Newspaper Publication is attached herewith.
Financial Results For The Quarter And Year Ended March 31 2026
30-May-2026 | Source : BSEFinancial Results for the quarter and year ended March 31 2026 are attached herewith.
Board Meeting Outcome for Outcome Of Board Meeting
30-May-2026 | Source : BSEOutcome of Board meeting is attached herewith
Corporate Actions

No Upcoming Board Meetings

No Dividend history available

No Splits history available

No Bonus history available

No Rights history available
Quality key factors
Valuation key factors
Technicals key factors
 Technical Indicator Scale: Bearish, Mildly Bearish, Sideways, Mildly Bullish, Bullish Turned
 Shareholding Snapshot : Mar 2026
Shareholding Compare (%holding)
Promoters
None
Held by 0 Schemes
Held by 0 FIIs
Sajjan Kanwar Bafna (30.47%)
Pankaj A Jain (1.58%)
28.3%
Quarterly Results Snapshot (Standalone) - Mar'26 - YoY

YoY Growth in quarter ended Mar 2026 is -64.32% vs 116.67% in Mar 2025
YoY Growth in quarter ended Mar 2026 is -206.38% vs 840.00% in Mar 2025
Half Yearly Results Snapshot (Standalone) - Sep'25

Growth in half year ended Sep 2025 is 69.89% vs 0.00% in Sep 2024
Growth in half year ended Sep 2025 is 107.80% vs 15.57% in Sep 2024
Nine Monthly Results Snapshot (Standalone) - Dec'25
YoY Growth in nine months ended Dec 2025 is 3.00% vs 45.19% in Dec 2024
YoY Growth in nine months ended Dec 2025 is 50.80% vs 23.15% in Dec 2024
Annual Results Snapshot (Standalone) - Mar'26
YoY Growth in year ended Mar 2026 is -21.39% vs 65.19% in Mar 2025
YoY Growth in year ended Mar 2026 is 9.73% vs 43.96% in Mar 2025
About Mansi Finance (Chennai) Ltd

Company Coordinates


