
Compare Manugraph India with Similar Stocks
Dashboard
Weak Long Term Fundamental Strength with an average Return on Equity (ROE) of 1.37%
- Poor long term growth as Operating profit has grown by an annual rate 18.72% of over the last 5 years
- Company's ability to service its debt is weak with a poor EBIT to Interest (avg) ratio of -3.98
Flat results in Mar 26
Consistent Underperformance against the benchmark over the last 3 years
Stock DNA
Industrial Manufacturing
INR 45 Cr (Micro Cap)
NA (Loss Making)
41
0.00%
0.01
6.87%
0.80
Total Returns (Price + Dividend) 
Latest dividend: 0.5 per share ex-dividend date: Dec-04-2019
Risk Adjusted Returns v/s
Returns Beta

News

Manugraph India Ltd is Rated Sell
Manugraph India Ltd is rated 'Sell' by MarketsMOJO, with this rating last updated on 11 February 2026. However, the analysis and financial metrics discussed here reflect the stock's current position as of 16 July 2026, providing investors with an up-to-date view of the company’s fundamentals, returns, and market performance.
Read full news article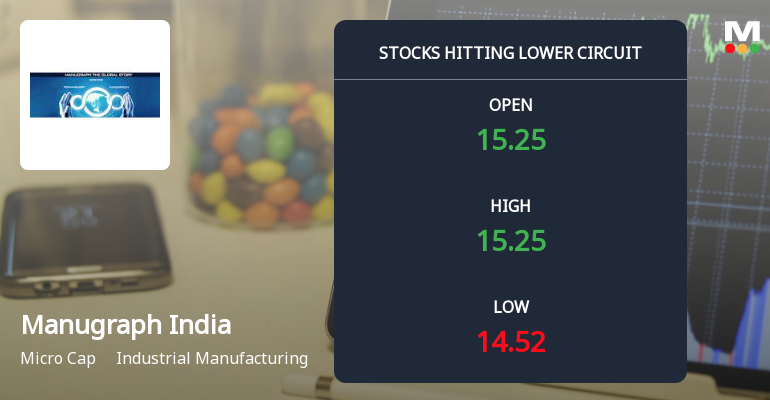
Manugraph India Ltd Locks at Lower Circuit With 4.94% Loss — Sellers Queue, No Buyers in Sight
At Rs 14.25, sellers were still queuing — but there were no buyers willing to take the other side. Manugraph India Ltd locked at its lower circuit of 5% on 13 Jul 2026, with unfilled sell orders and a frozen price.
Read full news article
Manugraph India Ltd is Rated Sell
Manugraph India Ltd is rated 'Sell' by MarketsMOJO, with this rating last updated on 11 February 2026. However, the analysis and financial metrics discussed here reflect the stock’s current position as of 30 June 2026, providing investors with an up-to-date view of the company’s fundamentals, returns, and market performance.
Read full news article Announcements
Announcement under Regulation 30 (LODR)-Meeting Updates
24-Jun-2026 | Source : BSEOutcome of Board Meeting - Reappointment of Directors
Announcement under Regulation 30 (LODR)-Newspaper Publication
20-May-2026 | Source : BSENewspaper Publication - Audited Results
Board Meeting Outcome for Outcome Of Board Meeting - Audited Results
19-May-2026 | Source : BSEOutcome of Board Meeting alongwith Audited Financial Results for the year ended 31/03/2026
Corporate Actions

No Upcoming Board Meetings

Manugraph India Ltd has declared 25% dividend, ex-date: 04 Dec 19

No Splits history available

No Bonus history available

No Rights history available
Quality key factors
Valuation key factors
Technicals key factors
 Technical Indicator Scale: Bearish, Mildly Bearish, Sideways, Mildly Bullish, Bullish Turned
 Shareholding Snapshot : Mar 2026
Shareholding Compare (%holding)
Promoters
None
Held by 1 Schemes (0.0%)
Held by 0 FIIs
Multigraph Machinery Co Pvt Ltd (19.74%)
Minal Bharat Patel (2.06%)
32.04%
Quarterly Results Snapshot (Standalone) - Mar'26 - YoY

YoY Growth in quarter ended Mar 2026 is -10.17% vs 91.17% in Mar 2025
YoY Growth in quarter ended Mar 2026 is -6.96% vs 73.07% in Mar 2025
Half Yearly Results Snapshot (Standalone) - Sep'25

Growth in half year ended Sep 2025 is 83.33% vs -10.58% in Sep 2024
Growth in half year ended Sep 2025 is 127.39% vs -70.79% in Sep 2024
Nine Monthly Results Snapshot (Standalone) - Dec'25
YoY Growth in nine months ended Dec 2025 is 102.23% vs -38.54% in Dec 2024
YoY Growth in nine months ended Dec 2025 is 124.24% vs -63.82% in Dec 2024
Annual Results Snapshot (Standalone) - Mar'26
YoY Growth in year ended Mar 2026 is 49.35% vs -9.75% in Mar 2025
YoY Growth in year ended Mar 2026 is 118.55% vs -34.39% in Mar 2025
About Manugraph India Ltd

Company Coordinates


